U.S. GDP at 1.5%, Trade Gap at $101B: The Slowdown Is Real
U.S. GDP decelerated to 1.5% in Q2 2026 and the trade deficit hit $101.5B in June. Here's what the macro data says about where the economy is headed.
Key Points
- U.S. GDP grew at just 1.5% annualized in Q2 2026, decelerating from the 1.8% pace recorded across the first half of the year.
- The trade deficit narrowed to $101.5 billion in June — but goods imports of $306.2 billion signal that tariff-driven front-loading is distorting the underlying demand picture.
- Wholesale inventories rising for a fifth consecutive month to $945.9 billion, combined with a softening GDP print, sets up a potential inventory-correction drag on Q3 growth.
The U.S. economy is decelerating, and the data have been saying so in unison for two months. Q2 2026 GDP came in at 1.5% annualized — the weakest quarterly reading of the year — even as the Fed holds its benchmark rate at 3.5%–3.75% and debates whether to tighten further. The June trade and inventory data released this week fill in the picture: a $101.5 billion goods deficit, a fifth straight month of rising wholesale inventories, and an import complex that may be masking genuine softness in final demand. The macro dashboard heading into Friday's CPI and next week's FOMC is not one of strength — it is one of a cycle that is bending under the weight of its own imbalances.
The Growth Deceleration in Context
Start with the headline: 1.5% annualized GDP growth in Q2 2026 is not a recession, but it is not the "solid pace" language the Fed has been deploying either. Governor Waller acknowledged that real GDP grew at a 1.8% annual rate across the first half of 2026 — a figure that blends a slightly stronger Q1 with the softer Q2 outcome. The directional trend is unambiguous: growth is slowing. The question the Fed cannot yet answer is whether that slowdown is a soft landing that stabilizes at trend growth near 1.5%–2.0%, or whether it represents the leading edge of a more significant demand contraction in the second half of the year.
The unemployment rate at 4.1% provides limited comfort in either direction. Seven million Americans are unemployed as of August. Youth unemployment — the 16-to-24 cohort — is running at 9.1%, a level that historically correlates with reduced consumer spending at the margin, since younger workers have less savings buffer and are disproportionately exposed to cyclical sectors. The labor market is not collapsing, but it is not the red-hot jobs environment that once gave the Fed the luxury of hiking aggressively. The June FOMC statement characterized economic activity as "expanding at a solid pace despite elevated uncertainty" — language that now looks generous relative to the Q2 GDP print.
What the growth data does not yet reflect is the full pass-through of tariff uncertainty on business investment decisions. The June FOMC statement specifically cited "productivity growth and capital investment" as strong, and Waller's risk framework flagged both AI-related technology goods price pressure and the threat of additional tariff escalations. If corporate capital expenditure plans are beginning to stall in Q3 — a plausible outcome given unresolved trade policy uncertainty and higher-for-longer rates — the Q3 GDP print could come in below 1.5%, putting the full-year 2026 number in jeopardy.
The Trade and Inventory Distortion
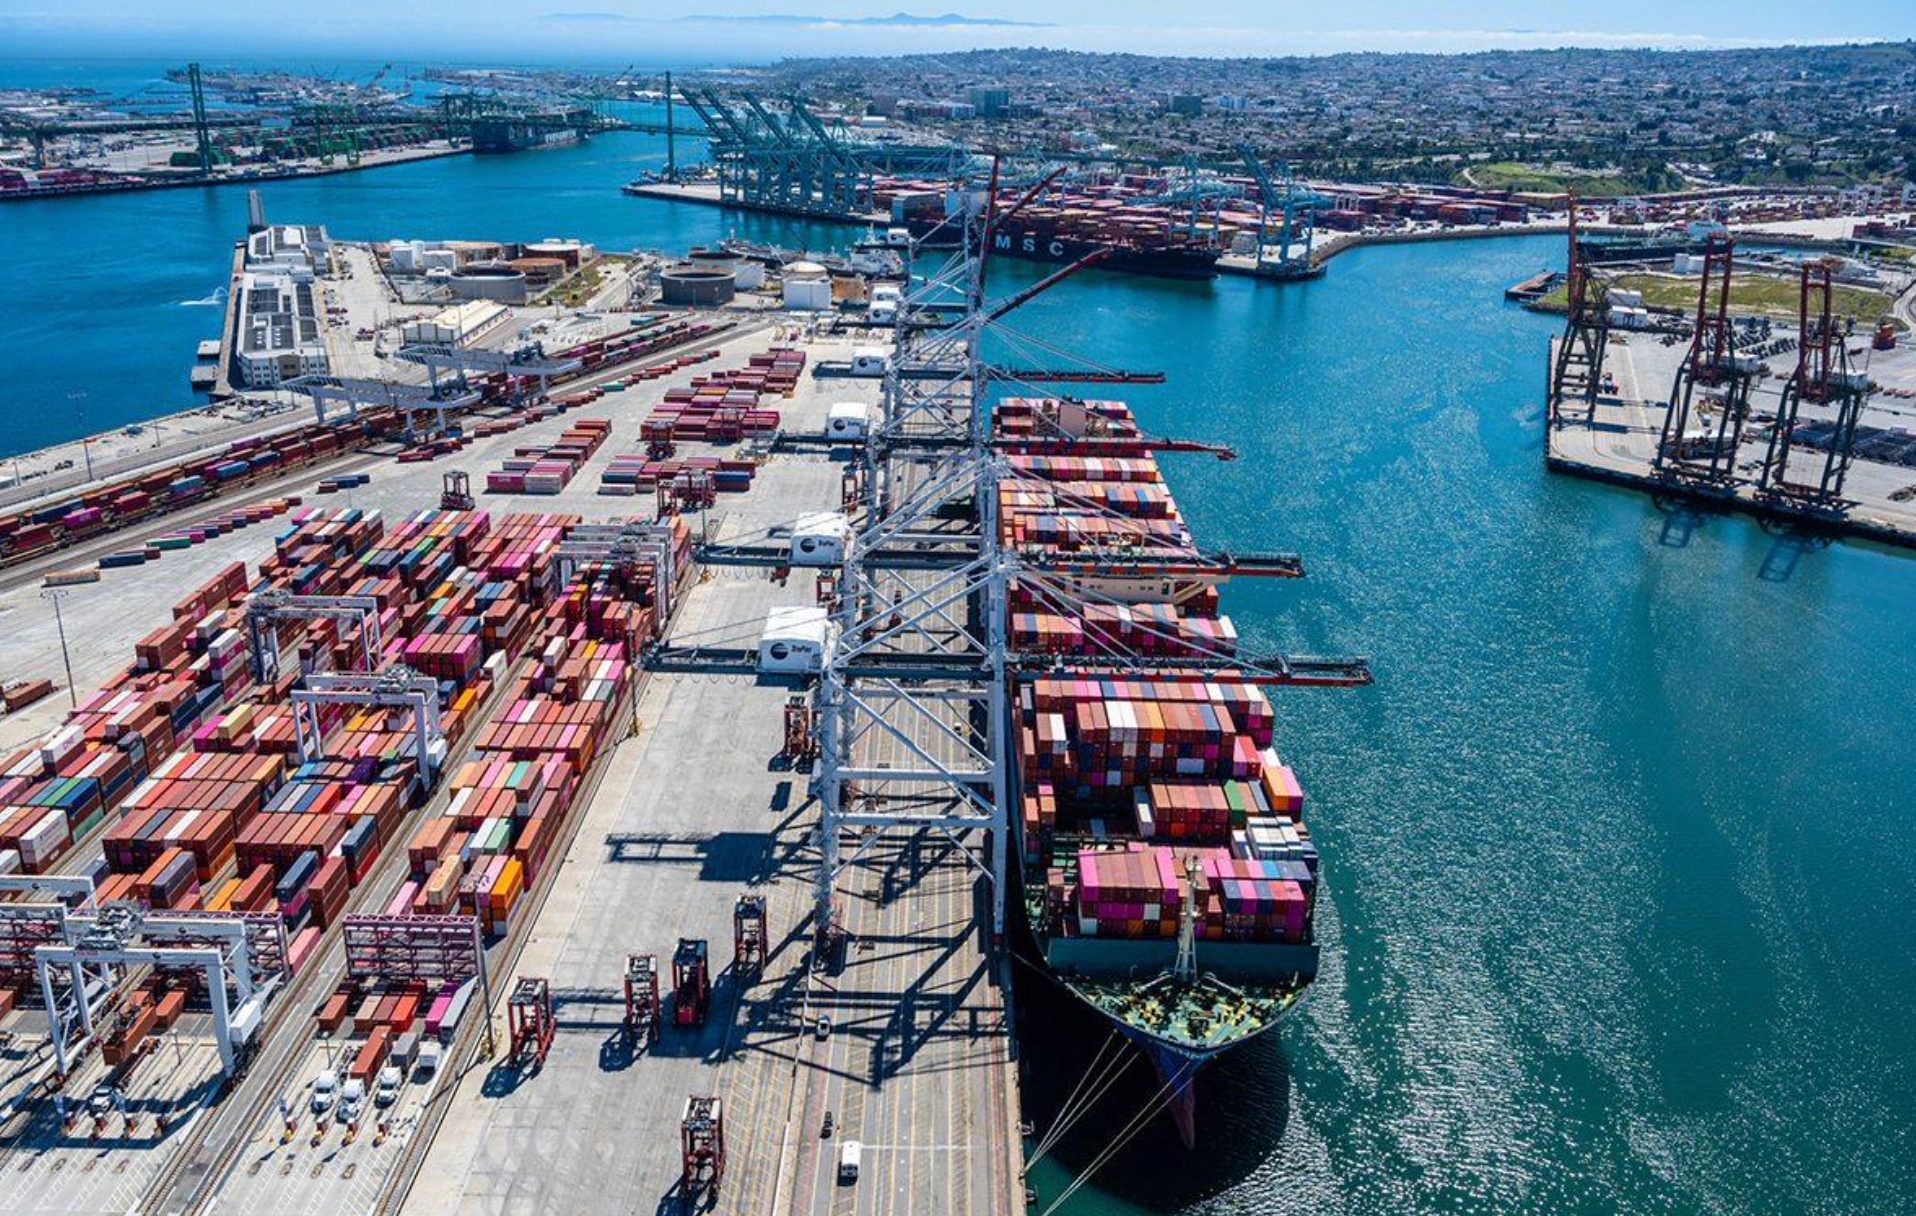
The June trade deficit narrowed to $101.5 billion from $105.9 billion in May — a $4.4 billion improvement that looks constructive on the surface. Dig one level deeper and the picture is more complicated. Goods exports came in at $204.7 billion while goods imports registered $306.2 billion. That $306 billion import figure is the one to interrogate: in an environment where tariff policy remains active and potentially escalating, importers have a strong incentive to pull forward purchases before new levies take effect. Front-loaded imports depress the trade balance in the near term but represent borrowed demand — a payback period that shows up as weaker import volumes in subsequent quarters.
The wholesale inventory data reinforces this read. Inventories rose 0.3% month-over-month in June to $945.9 billion, the fifth consecutive monthly increase, and are now running 4.4% higher on a year-over-year basis. The composition is telling: durable goods inventories rose 0.7%, driven by categories that overlap directly with the types of goods subject to or at risk from tariff actions. Nondurable goods inventories fell 0.4%, reversing May's gain. The divergence between durables and nondurables is not random — it is the fingerprint of deliberate inventory accumulation ahead of potential cost increases, not organic demand-driven restocking.
For the GDP accounting, this inventory build cuts both ways. In the quarter when inventory accumulates, it adds to GDP via the change-in-private-inventories component. When that inventory normalizes or runs down — particularly if final demand proves weaker than the restocking pace implies — the unwind becomes a direct subtraction from GDP. The five-month inventory build that has now brought stocks to $945.9 billion sets up exactly that dynamic heading into Q3 and Q4 2026. If consumer spending softens alongside the tariff front-loading reversal, the inventory correction could hit GDP at precisely the wrong moment.
What the Macro Picture Means for Markets
The Federal Reserve's policy dilemma — elevated inflation against a decelerating economy — is not new, but the data arriving in September 2026 have sharpened its edges considerably. The July CPI reading of -3.4% year-over-year provided a moment of apparent relief, but that relief must be weighed against an economy where energy prices are materially higher than at the start of 2026, where AI infrastructure investment is putting upward pressure on technology goods prices, and where tariff-driven inventory accumulation could translate into goods price increases in the months ahead. A Fed hiking into 1.5% GDP growth is not unprecedented — but it is a scenario that equity markets have not fully priced.
For the dollar, a September hike would be supportive at the margin, as the interest rate differential argument tightens against the euro — where eurozone GDP is projected at just 0.8% in 2026 and the ECB is holding rates unchanged with a risk balance tilted toward stagflation. The DXY strengthening in a hike scenario is a headwind for multinational earnings and for commodities priced in dollars. Gold, typically a haven in slowing-growth environments, faces the competing force of higher real rates if the Fed tightens while inflation comes in soft. The asset allocation calculus is genuinely complex.
The most important near-term datapoint is Friday's August CPI at 8:30 AM ET, followed by the FOMC decision on September 16. But traders should also mark the back end of the September calendar: GDP and PCE inflation are both on the docket later in the month. If Q3 GDP tracking deteriorates materially — and the inventory-correction risk outlined above is a live mechanism for that outcome — the September 16 FOMC decision could look premature within weeks. Watch the 4.1% unemployment rate as a leading signal; any move toward 4.3% or above in the October jobs report would fundamentally reframe the Fed's policy calculus heading into the November meeting.
The Weekly Investor
Daily market analysis for active traders. Free.