Fed's First Hike Since 2023 Resets the Rate Game
The Fed raised rates 25bp to 3.75%-4.00% on Sept. 16 — its first hike since 2023. Here's what the dot plot signals for November and beyond.
Key Points
- The Fed raised the federal funds rate 25 basis points to 3.75%–4.00% on September 16 — its first hike since July 2023 — on a unanimous 12–0 vote.
- The September SEP revised 2026 PCE inflation up a full percentage point to 3.7%, nearly double the 2% target, with 16 of 18 policymakers penciling in at least one more hike before year-end.
- Industrial Production data hit at 9:15 AM ET today — the first hard economic read post-hike — and every print between now and the November 5 FOMC meeting carries outsized market weight.
The Federal Reserve delivered its first rate increase in more than three years on September 16, lifting the federal funds target range to 3.75%–4.00% on a unanimous 12–0 vote and simultaneously releasing a Summary of Economic Projections that told traders everything they needed to know: this is almost certainly not the last hike of 2026. The dot plot shows 16 of 18 policymakers expect the rate to reach 4.00%–4.25% before December 31 — one more quarter-point move away.
The Fed's Inflation Problem
The pivot in the September SEP is stark. As recently as March 2026, the FOMC was projecting half a point of rate *cuts* across 2026 and 2027. Now those cuts have been replaced by hikes, and the Committee's median forecast for 2026 PCE inflation has been revised up by a full percentage point to 3.7%. That is not a rounding error — it is a complete directional reversal in less than six months, and it tells traders that the Fed spent the first half of this year materially underestimating the stickiness of price pressures.
What drove the upgrade? Energy prices have been the primary culprit keeping headline inflation elevated, and the labor market has refused to soften enough to give policymakers cover for patience. The unemployment rate projection for 2026 was actually revised *down* 30 basis points to 4.1% in the September SEP — meaning the Fed is hiking into a tighter-than-expected labor market while inflation runs at 3.7%. That is a stagflation-adjacent backdrop, and the Committee knows it, even if the statement language was careful to avoid the word.
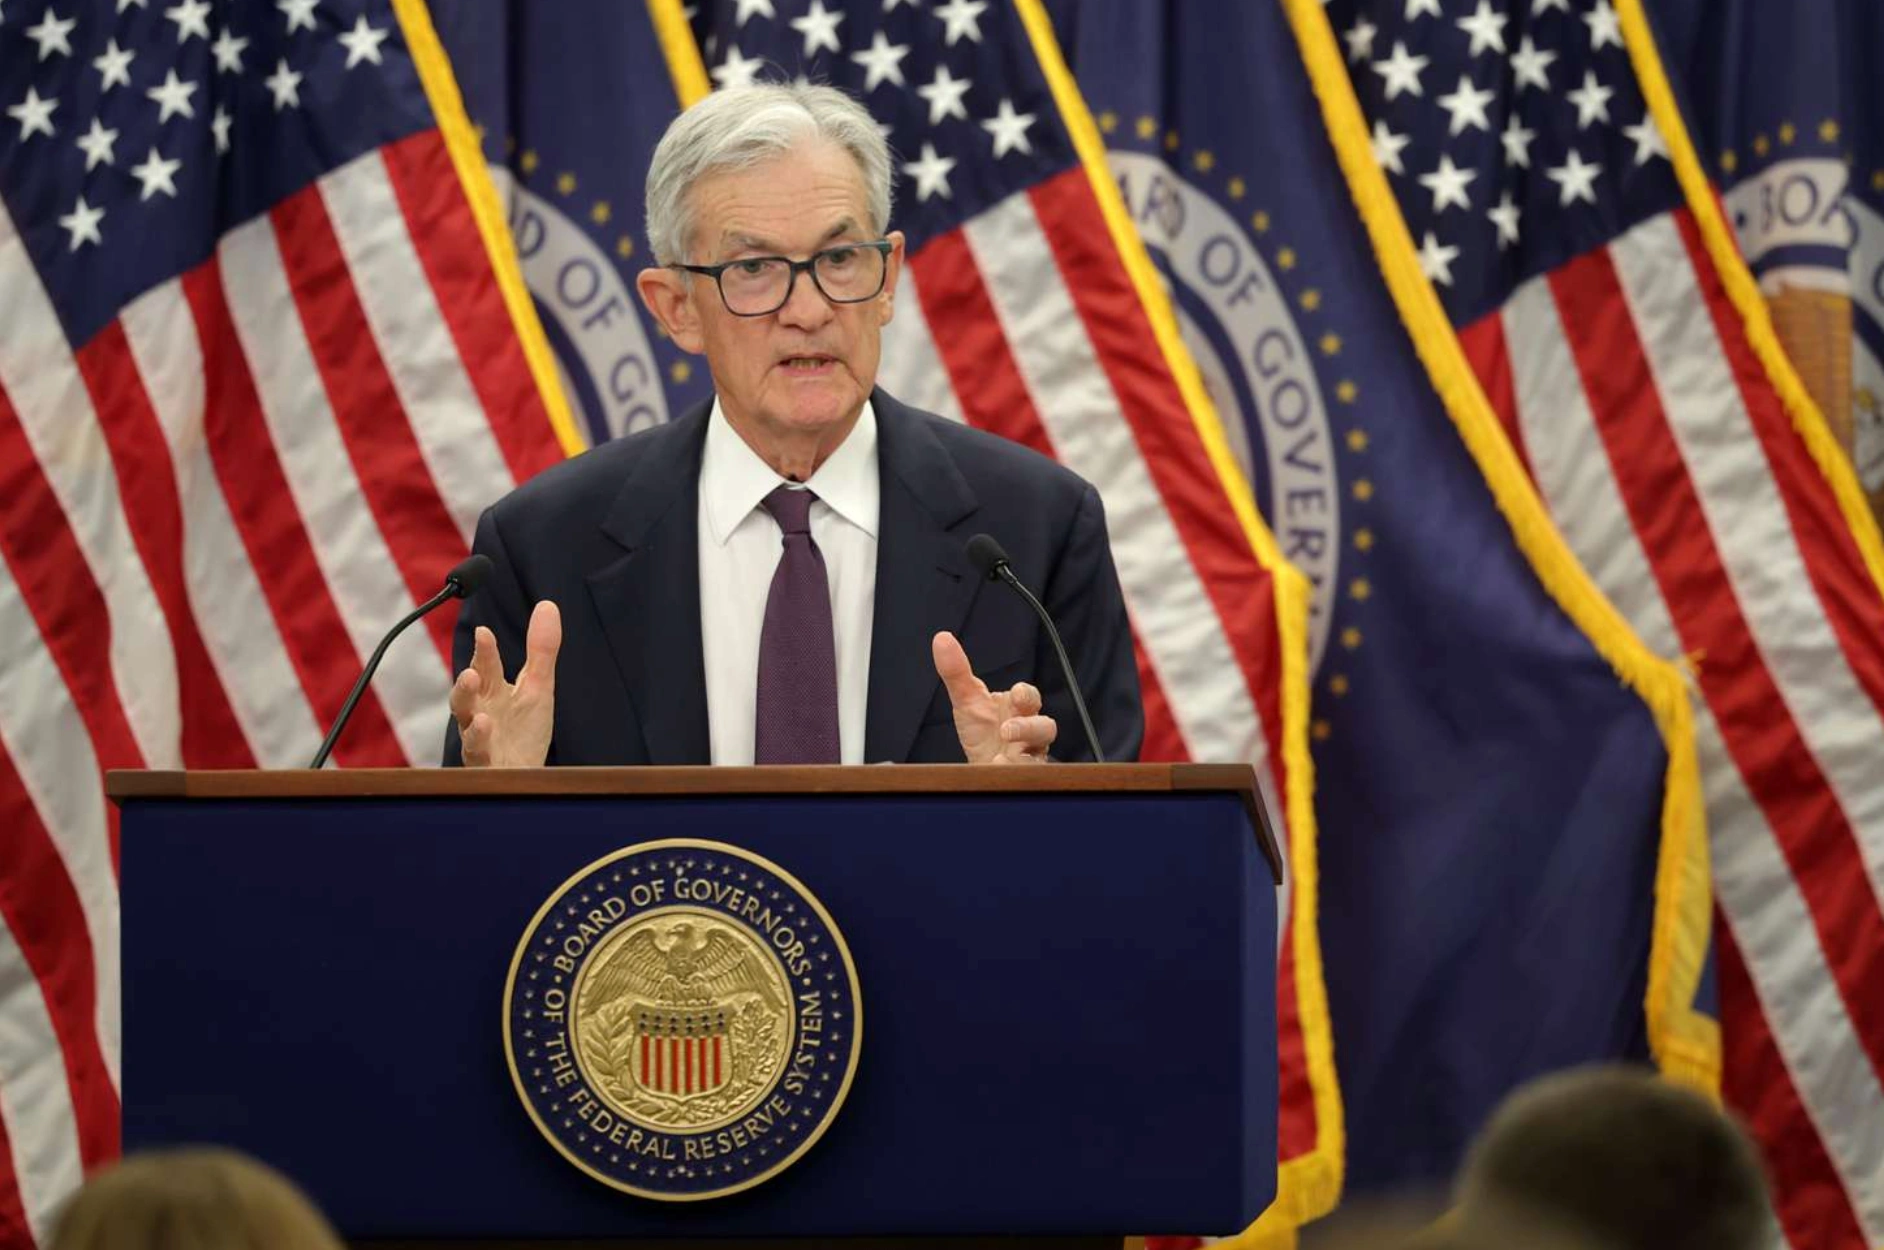
Chair Warsh's preference for minimal forward guidance kept the post-decision statement extremely brief, but the dot plot did the communicating for him. The September 2026 SEP also holds the 2027 year-end funds rate projection at 4.00%–4.25%, signaling that even after the anticipated November hike, the Fed does not currently see room to cut next year. Real GDP growth for 2026 was trimmed to 2.2% from 2.4% in March, and 2027 holds at 2.3% — a soft-landing scenario that requires inflation to cooperate in ways it has not yet demonstrated.
What the Market Is Pricing Now
U.S. stocks slipped immediately after the September 16 decision as markets absorbed both the hike and the hawkish dot plot. The reaction was not a panic, but it was directionally clear: equities are repricing the cost of capital upward, and the bid for duration is gone. Money market funds are the mechanical beneficiary — Vanguard's VMFXX was yielding 3.63% heading into the decision, and that 7-day yield is expected to move toward 3.88% over the next several weeks as the rate increase filters through overnight lending markets.
The bond market's response matters more for equity valuations. The 10-year Treasury yield is the discount rate embedded in every long-duration asset price, and with the Fed's own projections now showing rates at 4.00%–4.25% through 2027, there is no fundamental anchor pulling yields back down in the near term. For equities trading at elevated multiples — particularly in technology and growth — the math on discounted cash flows gets worse with every basis point added at the long end. The unanimous vote removes any ambiguity about internal dissent as a potential moderating force; there are no doves to rescue the rate-sensitive trade right now.
The Federal Reserve's full statement and SEP materials are publicly available and worth reading beyond the headlines. Warsh's brevity in the statement is itself a signal: he is letting the data — not guidance — do the work, which means every CPI, PCE, and labor-market print between now and November 5 will be treated by markets as forward guidance by proxy.
What Traders Watch Next
Today's Industrial Production report, released at 9:15 AM ET, is the first hard data point since Tuesday's hike. Capacity utilization will be equally important — if industrial output is holding above trend while inflation stays elevated, it reinforces the case for the November hike and pushes back against any narrative that economic weakness might give the Fed a reason to pause. The NY Fed Staff Nowcast, due at 12:45 PM ET today, will also update the Q3 GDP tracking estimate, which feeds directly into whether the 2.2% full-year growth projection looks achievable or optimistic.
The next scheduled FOMC meeting is November 5, 2026, and the data calendar between now and then is dense. August CPI printed at 3.4% year-over-year — still well above target — and the next CPI release lands October 14. September PPI follows October 15. Both reads arrive before the blackout period for the November meeting, meaning they will be processed in real time by policymakers and traders simultaneously. A CPI print above 3.5% in October would almost certainly cement the November hike; a reading at or below 3.2% could introduce meaningful debate about pausing, though the dot plot suggests even the doves are not positioned for that outcome.
The critical level to watch on the 10-year yield is 4.50%. A sustained break above that threshold — driven by either stronger-than-expected inflation data or additional Fed hawkishness — would represent a meaningful tightening of financial conditions beyond what the fed funds rate alone implies, and would put additional pressure on equity valuations and mortgage markets simultaneously. Mark November 5 on the calendar: barring a significant deterioration in growth or employment data before then, the next 25 basis points is already effectively priced.
The Weekly Investor
Daily market analysis for active traders. Free.