Fed's First Hike in 3 Years Sets Up October Showdown
The Fed raised rates 25 bps to 3.75%-4.00% in September 2026. With 16 of 18 dots signaling more hikes, October 28 is the date every trader needs to own.
Key Points
- The Fed raised the federal funds target range 25 basis points to 3.75%–4.00% on September 17, marking the first rate increase since 2023.
- Sixteen of 18 FOMC participants project at least one additional hike in 2026, with four members seeing room for two more — a decisively hawkish dot plot.
- The October 28 rate decision is now the fulcrum trade: today's JOLTS print and Wednesday's PCE data will determine whether the committee pulls the trigger again in four weeks.
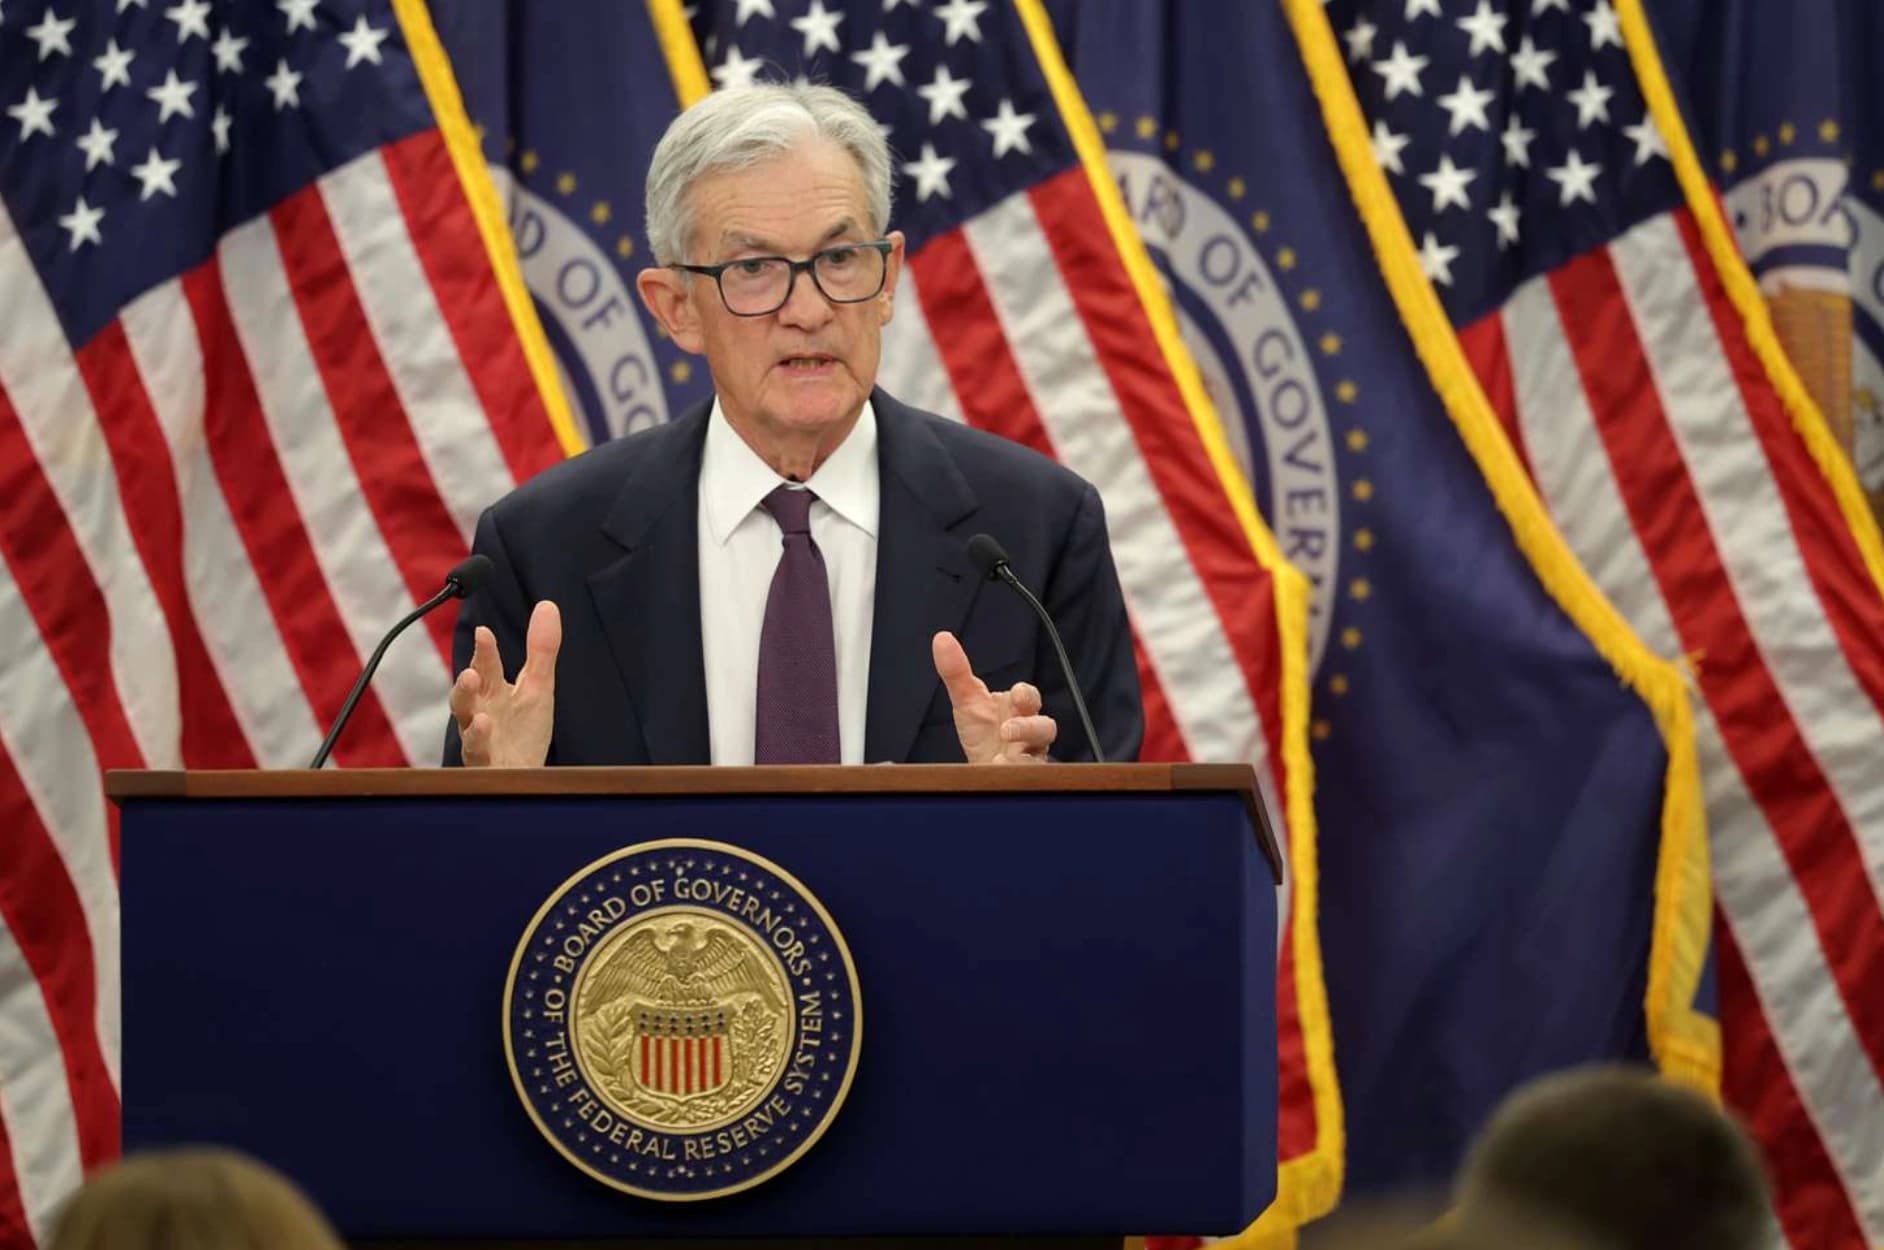
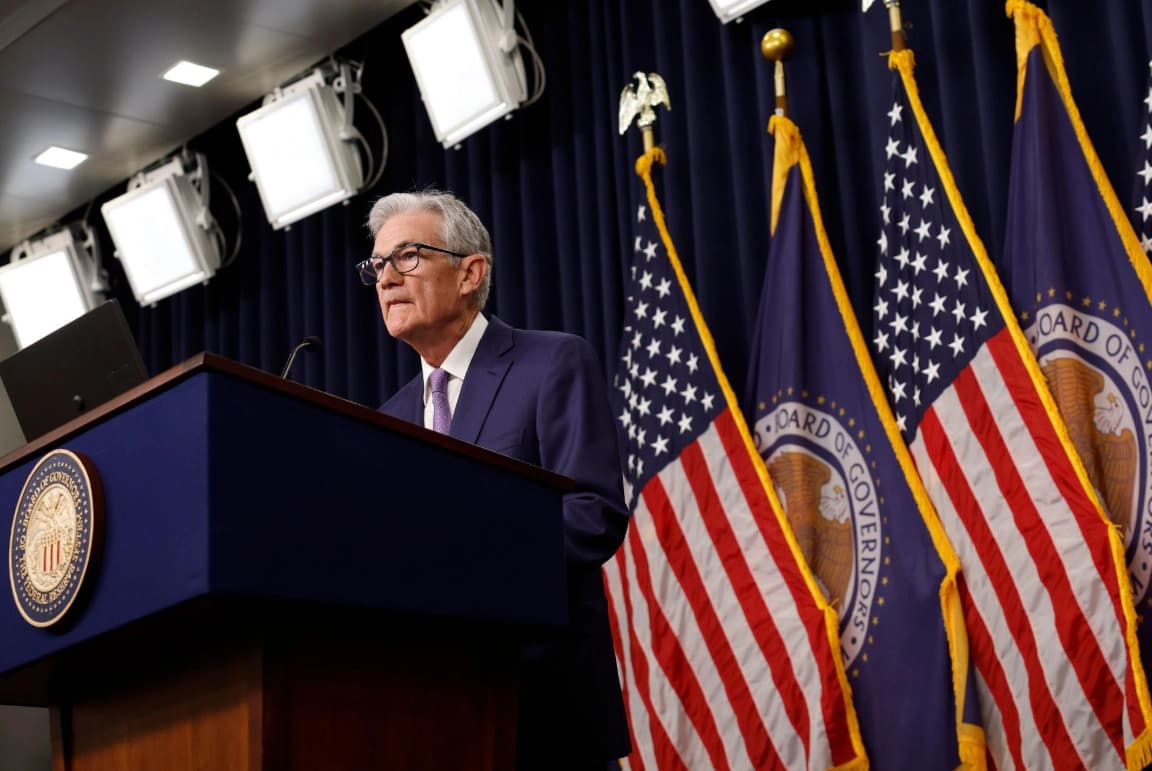
The Federal Reserve raised rates for the first time in three years at its September meeting, pushing the federal funds target range to 3.75%–4.00% — and the dots make clear this is not a one-and-done. Sixteen of 18 FOMC participants penciled in at least one more hike before year-end, with four of those seeing two additional moves still on the table. Chair Kevin Warsh's preference for brevity meant the statement itself told traders almost nothing. The dot plot told them everything.
The Anatomy of This Hike
The September move did not come out of nowhere. At the July meeting, three Fed presidents — Cleveland's Beth Hammack, Minneapolis's Neel Kashkari, and Dallas's Lorie Logan — dissented in favor of a 25-basis-point increase. They were outvoted then. They were vindicated now. The three-way dissent in July was the loudest possible signal that the committee's center of gravity was shifting, and Chair Warsh spent the intervening six weeks watching energy prices keep inflation elevated and domestic spending refuse to roll over before finally pulling the trigger.
What changed between July and September was not the data trend — it was the accumulation of evidence. Chair Warsh specifically flagged ongoing strength in consumer spending and continued AI-infrastructure investment as factors that kept demand from softening sufficiently. That framing matters: Warsh is not describing a one-time energy shock that will fade on its own. He is describing structural demand that, absent higher borrowing costs, has no obvious self-correcting mechanism. That language puts the burden of proof firmly on the doves heading into October 28.
The Dot Plot Is the Real Statement
The September dot plot is more informative than the statement itself, and traders should read it accordingly. The 16-of-18 figure for at least one additional 2026 hike is near-consensus. More telling is the distribution: four participants seeing two more moves means the committee's hawkish tail is not a fringe position. If the next two weeks of data — JOLTS today, ADP and PCE Wednesday, NFP on Friday — come in strong, that tail gets heavier, not lighter.
Critically, the dot plot does not show elevated projections in later years. Officials are signaling that this is a targeted adjustment to a specific inflation shock — energy-driven, demand-amplified — rather than the opening salvo of a multi-year tightening cycle reminiscent of 2022–2023. That distinction has real asset-allocation consequences. Long-duration Treasuries face near-term pressure from the October hike risk, but the terminal rate implied by the dots is not dramatically higher than current levels. TLT has already absorbed significant pain; the question for bond traders is whether the next 25 basis points is already in the price or whether a hot PCE print Wednesday reopens the rate-path debate entirely.
Three Fed officials are speaking today — Austan Goolsbee, Michael Barr, and Michelle Bowman — and their tone will be the first real-time read on how the committee interprets its own September action. Goolsbee has historically been the most data-sensitive voice on the committee; if he sounds comfortable with October, that is a meaningful shift from his prior posture. Barr and Bowman are likely to stay closer to the official line, but any deviation from a neutral-to-hawkish framing would be market-moving. Watch the Federal Reserve's official speech calendar for release times — all three are scheduled today.
What Traders Watch Next
The synchronized global tightening backdrop amplifies the Fed's move in ways that the dot plot alone cannot capture. The ECB has delivered a cumulative 50 basis points of hikes in 2026, bringing its deposit facility rate to 2.65%. The Bank of Japan raised 25 basis points this month. The Bank of England held but pre-committed to a hike. The one outlier is the SNB, which cut to 0.0% in June to combat deflation and franc strength — a reminder that not every economy is running the same playbook, but that the dominant global impulse is clearly restrictive. When the Fed, ECB, and BoJ are all tightening simultaneously, the cross-asset transmission is faster and more correlated than in any single-bank cycle.
For U.S. equity traders, the Fed's framing of AI-infrastructure investment as a demand sustainer is a double-edged signal. It explains why the committee felt comfortable hiking — the economy has enough momentum to absorb higher rates. It also caps the downside for risk assets in a way that a purely energy-shock-driven inflation story would not. If Warsh believes AI capex is a structural demand floor, then the soft-landing probability stays higher than the headline rate level implies.
The level to watch on TLT is $88. A break below that figure — driven by a hot PCE or a strong NFP this Friday — would signal that the bond market is pricing a second 2026 hike as the base case, not a tail risk. On the dollar index (DXY), the synchronized tightening has already provided a bid, but the ECB's 50 basis points of cumulative hikes this year means the euro is not the obvious short it was in previous Fed cycles. Traders leaning on the dollar long as a pure Fed-divergence play need to account for the fact that the ECB's tightening path has materially narrowed that spread. October 28 is the date. PCE Wednesday is the setup. Position accordingly before Friday's jobs number resets the entire conversation.
The Weekly Investor
Daily market analysis for active traders. Free.