Hawks vs. Doves: Inside the FOMC's Closest Call Since 2024
Fed holds at 3.50–3.75% with 64% probability, but a 23-point swing in one week signals hawks are gaining. Wednesday's statement is the only trade that matters.
Key Points
- The market-implied probability of a July hold collapsed from 87.2% to 64.2% in a single week ending July 24, the sharpest one-week hawkish repricing in over a year.
- With CPI at 3.5%, core CPI at 2.6%, and the 10-year yield at 4.71%, the Fed is caught between an inflation problem that hasn't closed and an economy that hasn't buckled.
- The Wednesday 2:00 PM ET statement — carrying no dot plot — plus Thursday's Q2 GDP and Core PCE release will together set the rate path for the remainder of 2026.
The Fed's hawks moved 23 percentage points in one week. That is the single most important number heading into Wednesday's 2:00 PM ET FOMC statement — not because a July hike is the base case, but because a probability that moved from 87.2% to 64.2% hold in seven days tells you the bond market is no longer comfortable with the dovish consensus that dominated June. The FOMC meeting is underway. The blackout is in effect. And for the next 48 hours, every macro print that crosses the tape is ammunition for one side of that internal debate.
The Rate Math Isn't Comfortable
Start with what the Fed actually controls versus what it cannot. The effective fed funds rate is 3.63%, SOFR is 3.64%, and the target band sits at 3.50%–3.75% — exactly where it has been since the FOMC last moved at the March 2026 meeting. In the interim, CPI inflation has run at 3.5% year-over-year through June 1, with core CPI at 2.6%. Those numbers mean the real fed funds rate — nominal minus core CPI — is approximately 100 basis points positive. That sounds restrictive, and in a mechanical sense it is. But the economy is not behaving like a patient on tight monetary policy. Unemployment is 4.2%, not climbing toward 5%. WTI crude is $80.77 a barrel as of mid-July, not collapsing in a demand destruction signal. And this morning's durable goods core capex proxy printed at +1.4%, ahead of estimates.
The spread between the 10-year Treasury at 4.71% and the 2-year at 4.37% has now normalized to 34 basis points positive — a curve that spent most of 2023 and 2024 deeply inverted. A positively sloped curve is generally associated with growth expectations holding up, but in the current context it also reflects the bond market pricing in a scenario where the Fed is not done. The long end is demanding more compensation for duration risk than at any point since 2023, and that matters directly for corporate financing costs, mortgage rates, and the real-economy transmission of monetary policy that the Fed's models depend on.
Inside the Hawk-Dove Divide
The June 2026 FOMC statement confirmed that the committee held its target range and described inflation as "remaining elevated relative to the 2% goal." That language was unanimous — but unanimity at the statement level often masks significant internal disagreement about the forward path, and the post-meeting communications from individual Fed officials in the weeks since have made the fracture visible. MNI's July preview, headlined "Fed To Hold Fire But Hawks Take Aim," captures the current state of play accurately: the base case remains a hold, but at least a minority of voting members are prepared to argue for a hike if Thursday's Core PCE and Q2 GDP data deliver an upside surprise.
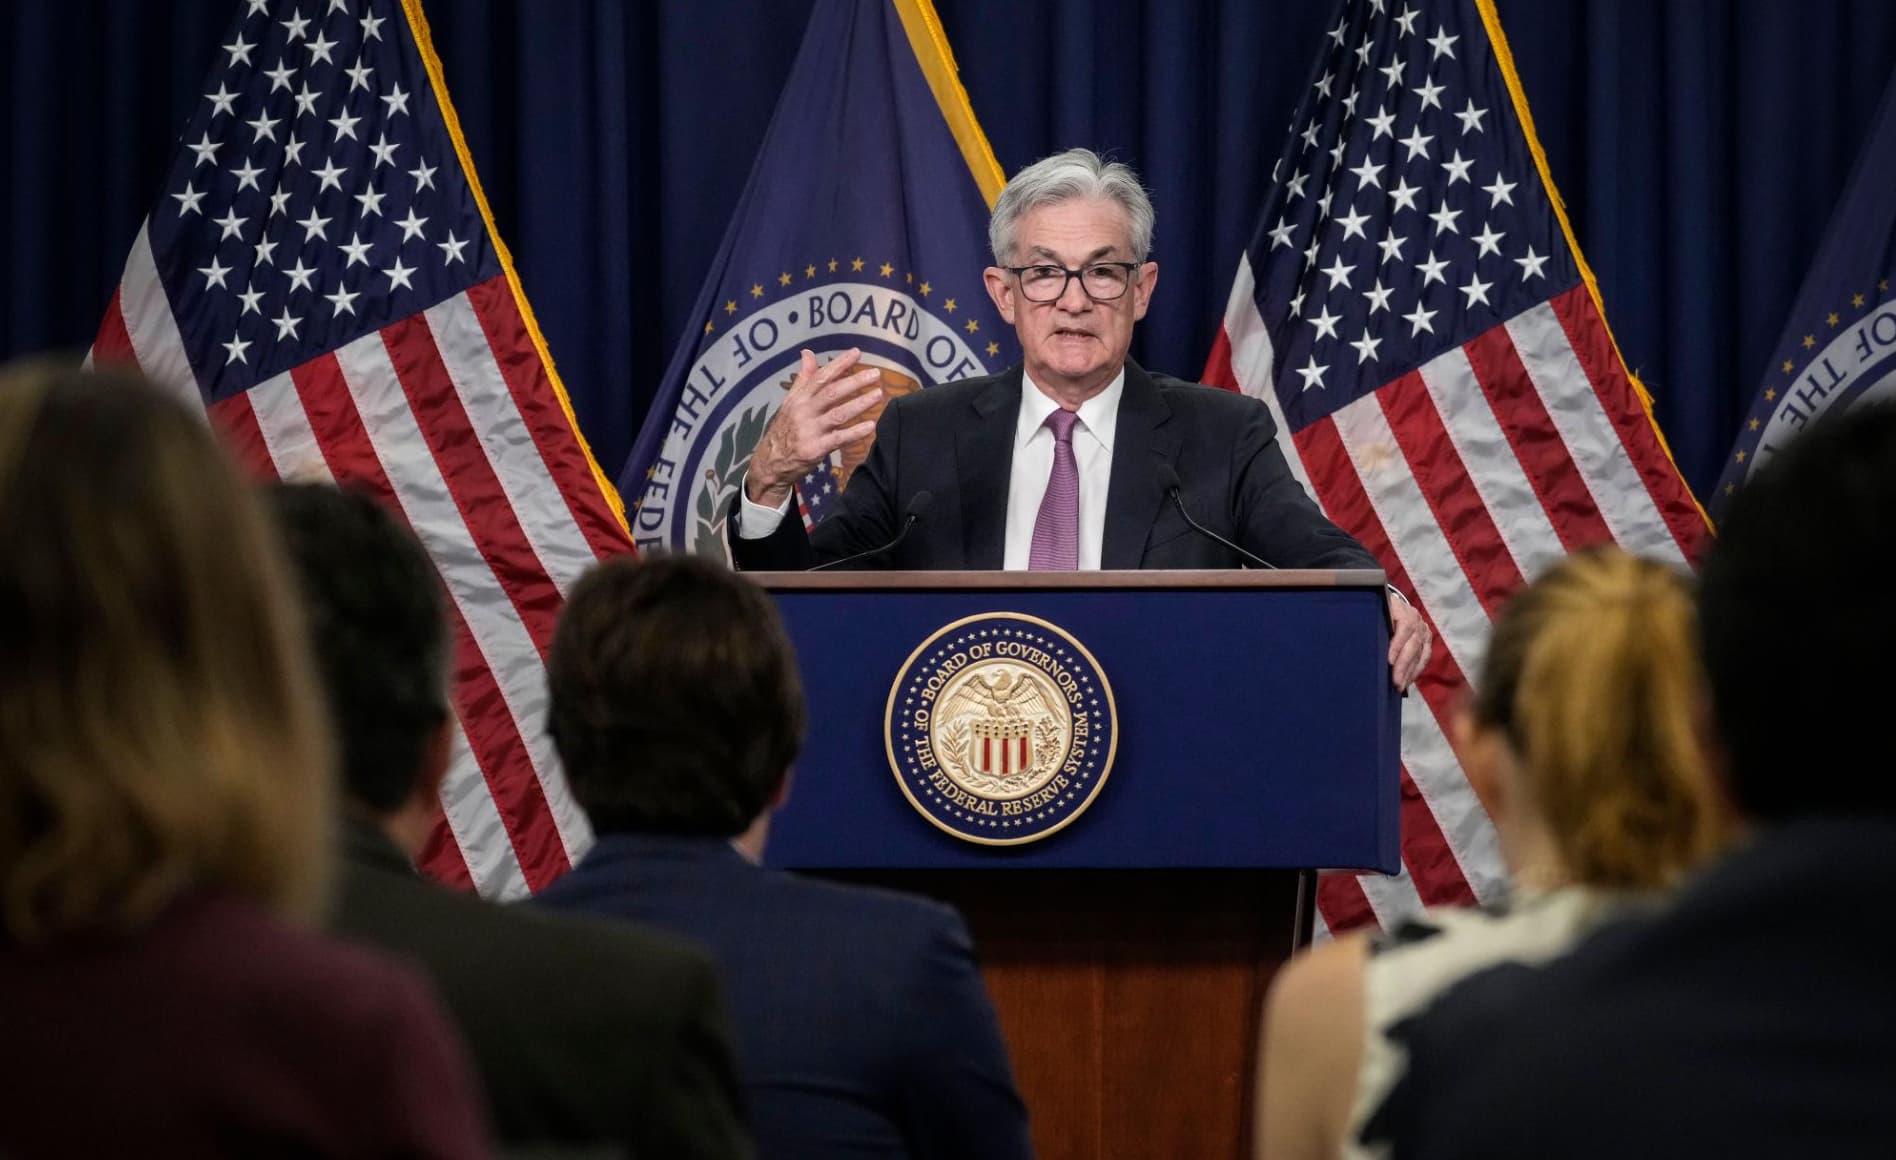
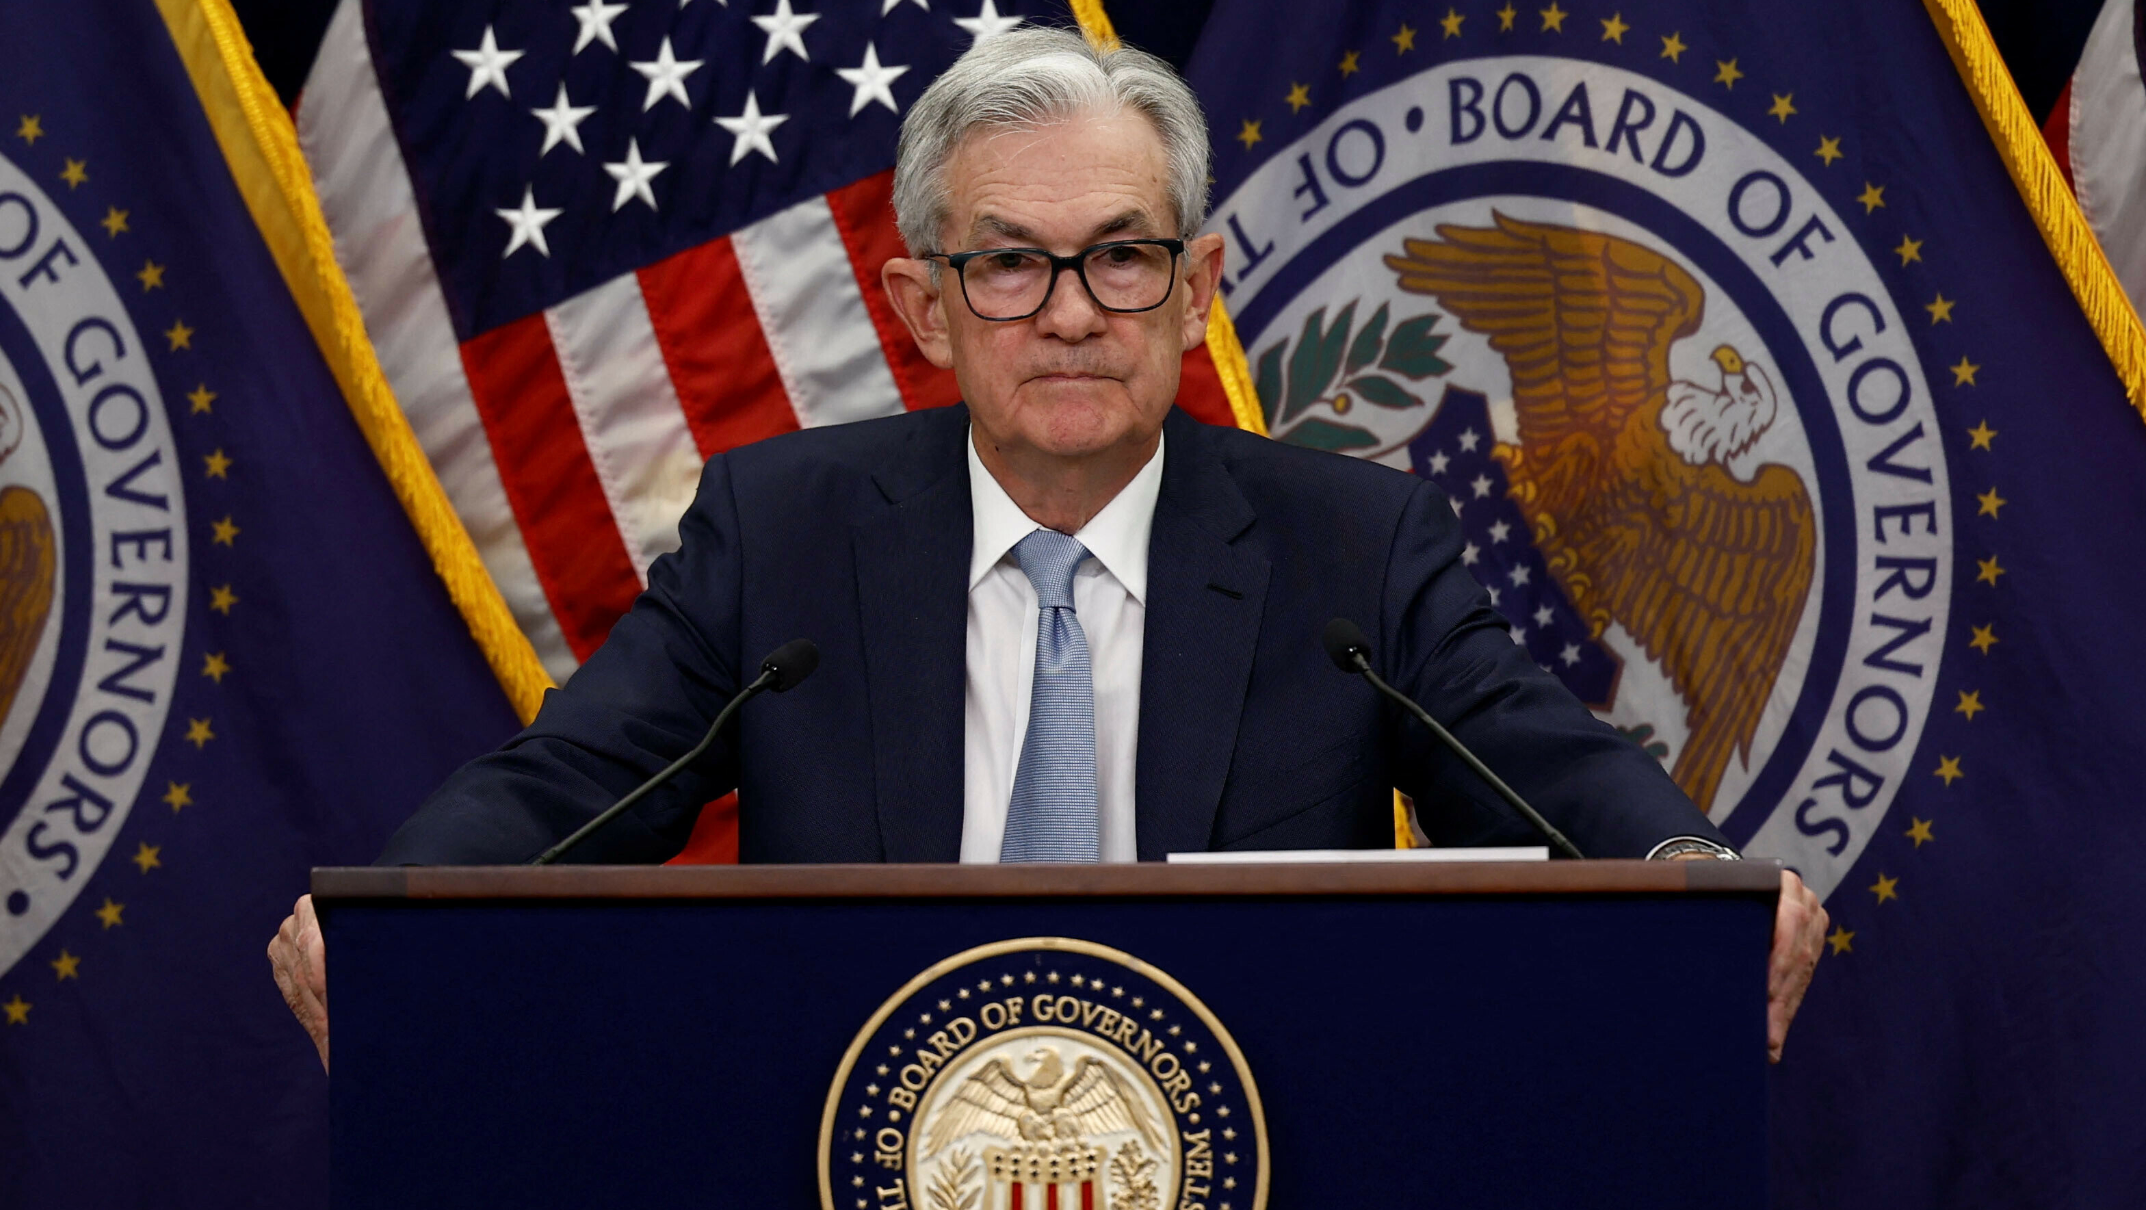
This meeting carries no updated Summary of Economic Projections — no dot plot, no revised median fed funds path, no new inflation or growth forecasts. That absence is structurally significant because it forces the entire information content of the meeting into two channels: the statement language itself, and whatever Powell says in the 2:30 PM press conference. Experienced traders know what to look for in the statement: watch whether the phrase "attentive to upside inflation risks" remains, whether the description of economic activity strengthens or softens, and whether any language around "the committee is prepared to adjust the stance" appears for the first time. Any one of those changes is a tradeable signal independent of the actual rate decision. The MNI Markets FOMC calendar is the cleanest public source for tracking statement language drift meeting-to-meeting.
The international context adds another layer that the Fed cannot ignore. The ECB held rates at its July 23 meeting — a unanimous decision — but post-meeting sources confirmed that a September hike is under active consideration in Frankfurt. The BOJ reports its quarterly outlook on July 31. The Bank of England decides Thursday. A rare G3 central bank convergence in a single week, with all three institutions facing versions of the same problem: inflation that has not returned to target and growth that has not rolled over enough to justify easing. If the ECB signals a September hike and the BOJ holds without dovish guidance, Powell's room to communicate patience narrows further. The dollar index and the front end of the US curve will price that cross-border dynamic in real time.
What Traders Watch Next
The sequencing for the rest of this week is the most important macro calendar of 2026 to date. Wednesday at 2:00 PM ET: FOMC statement. Wednesday at 2:30 PM: Powell press conference. Thursday morning: Q2 advance GDP (consensus +2.3% annualized QoQ) and Core PCE — the Fed's preferred inflation gauge — simultaneously. The GDP and PCE prints arrive before markets open Thursday and will be the first hard read on whether the second quarter validated the soft-landing thesis or quietly began to undermine it.
If Q2 GDP prints at or above 2.5% and Core PCE holds above 2.5% year-over-year, the 36% probability of a July hike that markets are currently pricing will look not just plausible but underpriced — and the re-rating will happen instantly. Kiplinger's economic calendar has the full release schedule. In that scenario, TLT — currently the cleanest expression of duration risk in the US market — is the most exposed instrument. The ETF is effectively a leveraged bet on the Fed staying on hold and eventually cutting, and a GDP/PCE combination that prints hot on Thursday morning would reprice that bet violently. Conversely, a GDP print below 2.0% with Core PCE decelerating toward 2.3% would validate the dovish hold, TLT would catch a bid, and rate-sensitive equities — utilities, homebuilders, regional banks — would rally into the weekend. The specific line in the sand for the 10-year yield is 4.85%: above that level, the cost of capital argument against equities becomes structural, not tactical. Watch for it Thursday morning.
The Weekly Investor
Daily market analysis for active traders. Free.