Fed Hikes 25 bps, VIX Spikes — What Comes Next
The Fed's 25 bps hike sent the Dow down 614 points and spiked the VIX to 17.62. Here's the rate path, the inflation wildcard, and key levels traders must watch.
Key Points
- The Federal Reserve raised its benchmark rate 25 basis points Wednesday, and FOMC median projections now signal one to two additional hikes before year-end alongside upward revisions to both inflation and GDP.
- Chair Kevin Warsh's explicitly hawkish press conference tone — compounded by WTI crude holding above $101 a barrel — has given the market no clear off-ramp from the tightening narrative.
- The S&P 500's 7,600 level, near the 50-day moving average, is the fulcrum: a sustained break below it opens the door to 7,490, while holding it keeps the bull case alive into year-end.
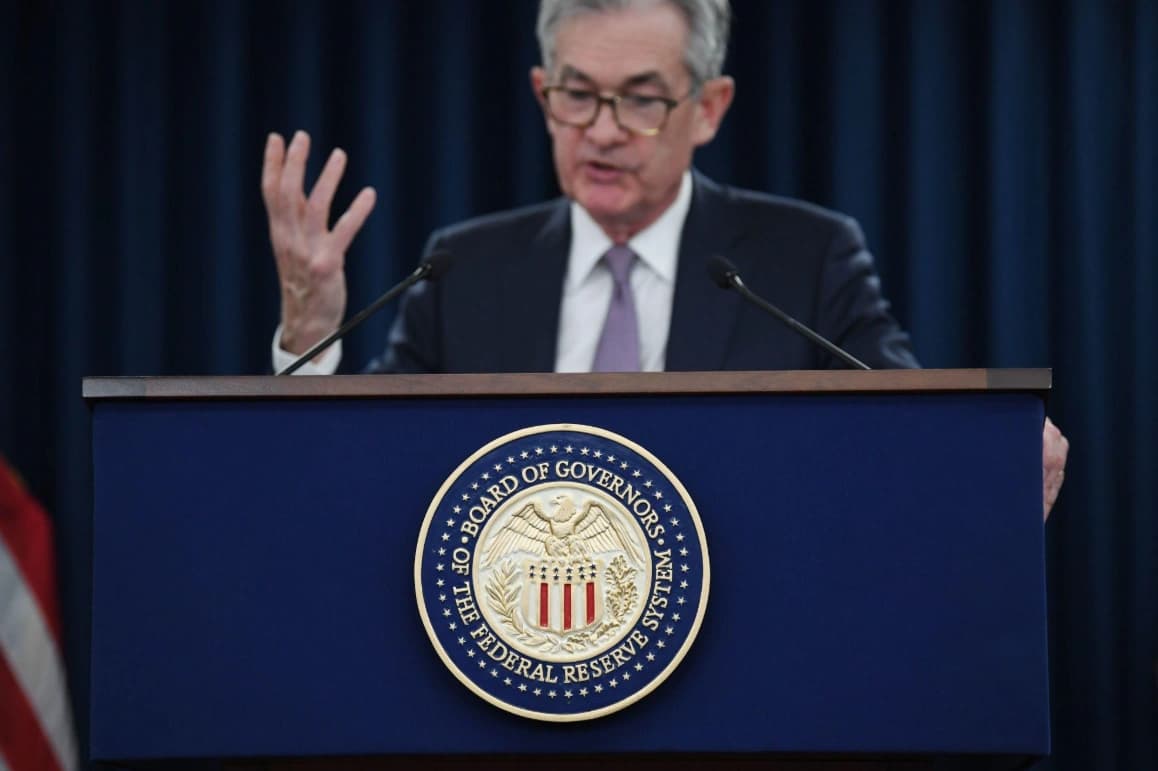
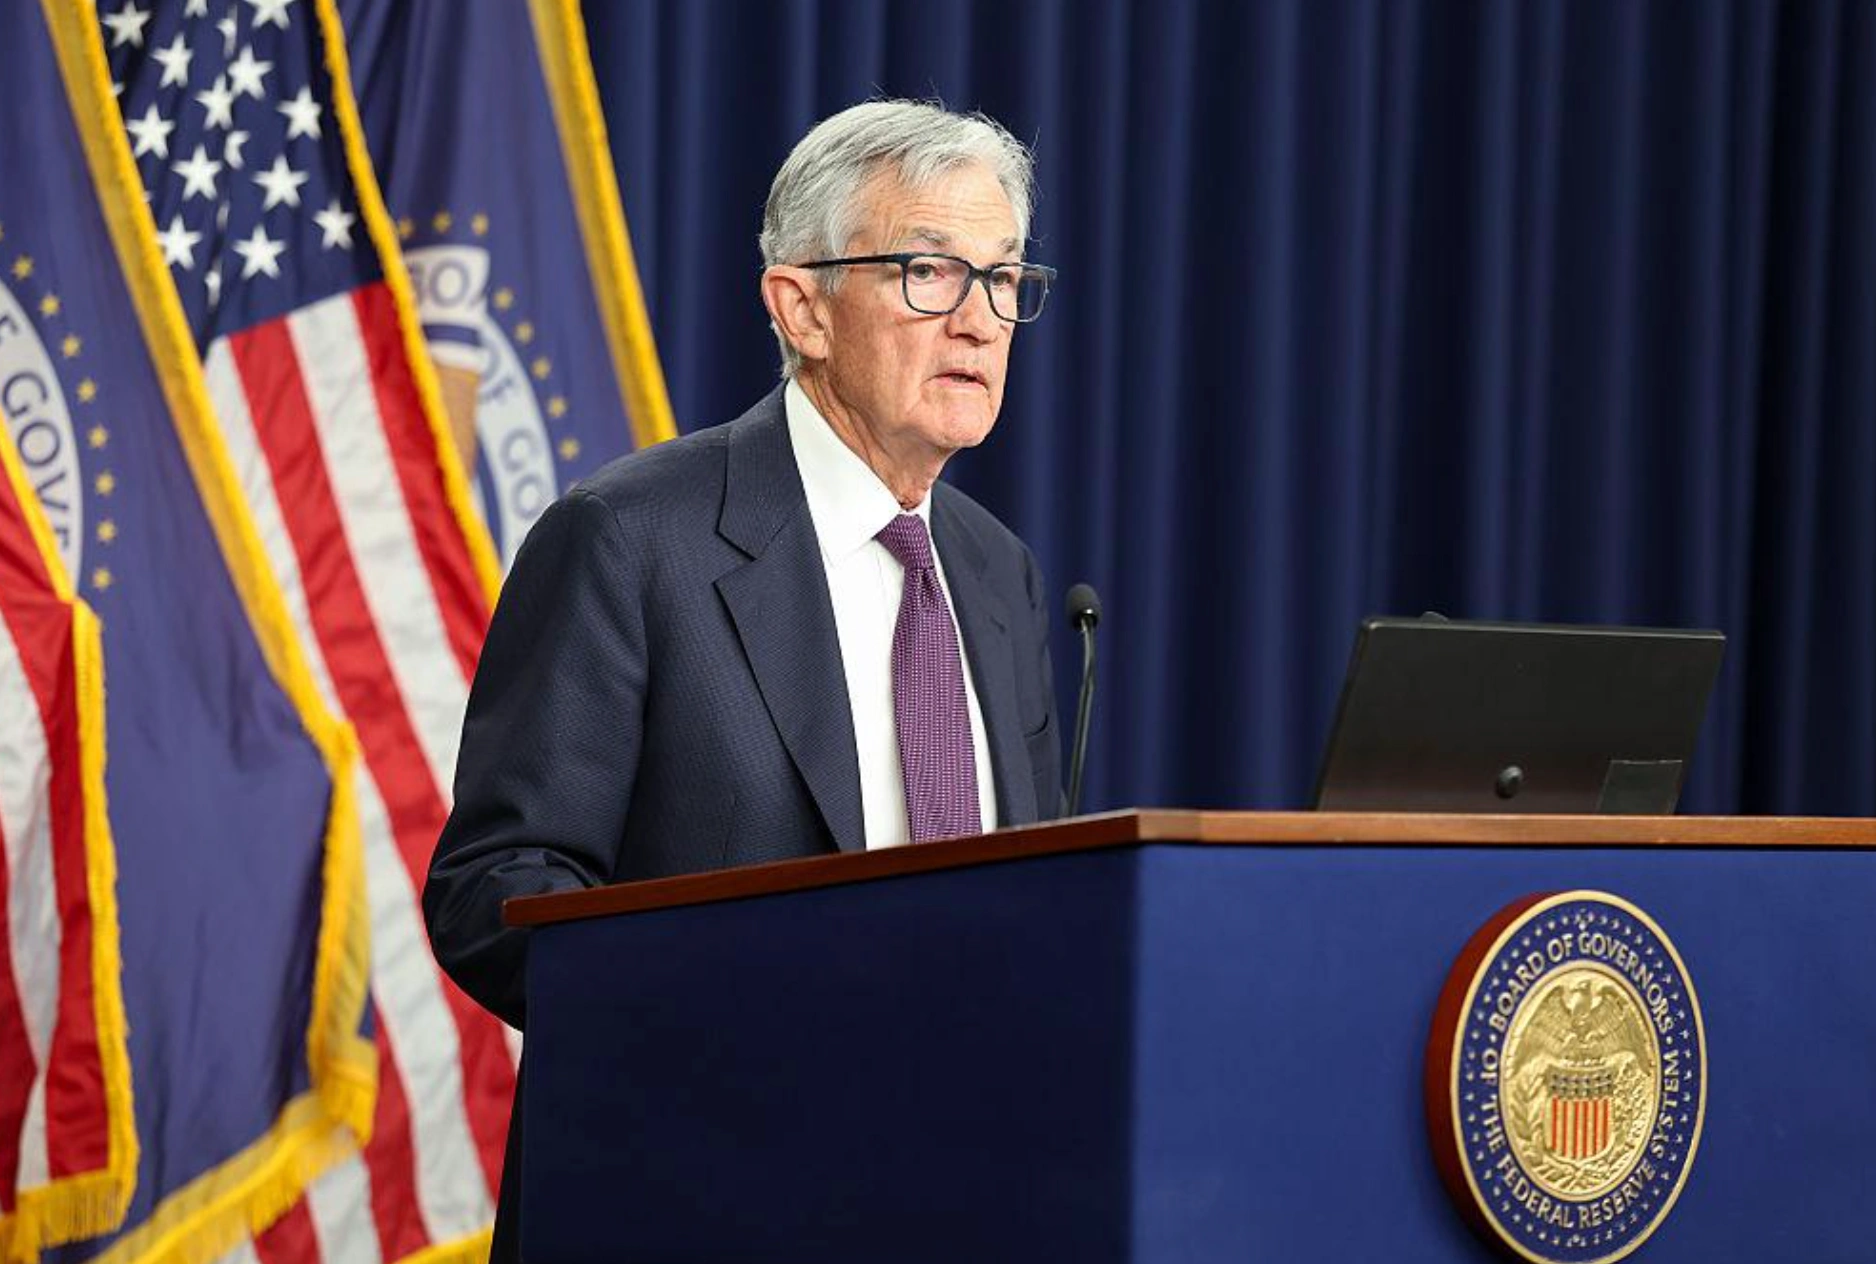
The Federal Reserve hiked rates 25 basis points Wednesday, its median dot plot now penciling in one to two additional increases before December 31 — and Chair Kevin Warsh left no ambiguity at the podium about his willingness to go further. The Dow Jones Industrial Average fell 614 points in response, the S&P 500 closed at 7,551.81, and the VIX surged to 17.62, up 11.24% in a single session. Thursday's modest futures bounce — S&P futures +0.3%, Nasdaq futures +0.5% — looks less like a conviction reversal and more like a reflex.
What the Fed Actually Said
The 25-basis-point move itself was fully priced. What the market was not fully priced for was the combination of upward revisions to both inflation and GDP in the same dot plot, alongside a lower unemployment projection. That trifecta — stronger growth, stickier prices, tighter labor — is the policy nightmare scenario for rate-sensitive equities because it removes the Fed's primary justification for pausing. When the economy is running hot and inflation is not cooperating, a central bank that has already spent credibility on premature pivots cannot afford to blink. Warsh, who has been vocal about the Fed's historical tendency to ease too quickly, made that arithmetic explicit on Wednesday afternoon.
The dot plot's signal of one to two additional hikes is the number traders need to carry into every position decision for the next three months. Historically, the Fed's end-of-year projections released in September have proven directionally accurate even when the specific timing shifted. If the committee is projecting a terminal rate meaningfully above current levels, the discount rate applied to long-duration assets — growth stocks, speculative tech, anything priced on 2028 earnings — moves against the bulls. The Nasdaq 100 closed virtually flat Wednesday at 25,978.43, a deceptive print that masked significant intraday selling that was absorbed by late-session buying in semiconductor names.
The Oil Wildcard
WTI crude at $101.46 — down 0.95% Thursday but still comfortably above the $100 psychological threshold — is the variable that makes the Fed's job structurally harder and the market's path structurally narrower. Oil above $100 per barrel does two things simultaneously: it keeps headline CPI elevated through gasoline and transportation costs, and it functions as a tax on consumer discretionary spending. Both effects argue for the Fed to maintain its hawkish posture even if core inflation data softens. Brent crude at $104.51, down 1.25% Thursday, tells the same story on a global basis.
The energy complex has been grinding higher for most of the third quarter, and the inflation revisions in Wednesday's dot plot almost certainly reflect that reality. The Fed does not target oil prices, but it does target their downstream effects, and those effects are now measurable in the PCE data that the committee watches most closely. Goldman Sachs fell 3.92% on Wednesday, and while the firm's equity was caught in the broad post-hike selloff, the underlying message from the financials sector is relevant: higher-for-longer rates compress net interest margins on the lending side even as they nominally benefit deposit spreads, and the curve shape matters as much as the level. A flat or inverted curve at elevated absolute rates is not a friendly environment for bank earnings.
What Traders Watch Next
The S&P 500 closed Wednesday at 7,551.81, below the 7,600 level that technicians have flagged as the critical near-term support zone — a level tied to the 50-day moving average and tested successfully on Monday. Thursday's futures-implied open of 7,618.60, up 66 points, would push the cash market back above that threshold on the open. Whether it holds through the session is the day's defining question. A close above 7,600 resets the technical picture toward neutral. A close back below it, particularly on volume, opens the door to the next support cluster near 7,490.
The CNN Fear & Greed Index sitting at 26 — squarely in Fear territory — is a contrarian data point worth keeping in view. Historically, readings below 25 have coincided with short-term market bottoms as forced selling exhausts itself, though the current macro regime of active Fed tightening distinguishes this episode from the sentiment-driven dips of the 2023–2025 bull run. The VIX range over the past 52 weeks runs from 13.38 to 35.30, and at 17.62 it is elevated relative to the mid-August lows but nowhere near the panic readings that would signal a washout. The market is afraid. It is not broken.
Wednesday's worst Dow components — IBM down 4.32%, Goldman Sachs down 3.92%, Boeing down 3.69% — will be the tell on Thursday. If those names recover with volume, the session's futures bounce has legs. If they open higher and fade, the relief rally is a selling opportunity. The year-to-date context matters: the S&P 500 remains 14.54% higher than it was twelve months ago, meaning even a correction to the 7,490 support level would represent a healthy digestion of gains rather than a trend break. The bull market is being tested, not ended — but the cost of ignoring the Fed's explicit signaling on additional hikes before year-end has gone up materially after Wednesday's press conference.
The next hard date on the calendar is the Fed's November meeting, which will arrive with a fresh CPI print and another round of labor market data. If WTI holds above $100 and the September jobs report — due in early October — prints above 150,000, the case for a November hike becomes very difficult to argue against. Traders running long equity duration into October need to own that risk explicitly. The S&P 500 at 7,600 is the line. Below it, the conversation changes.
The Weekly Investor
Daily market analysis for active traders. Free.