Semis ETFs Face $2T Flow Test After Asia Selloff
SOXX up 113% YTD and DRAM up 166% face their first real stress test as chip stocks drop and ETF inflows hit a record $1 trillion at halftime.
Key Points
- SOXX is up 113% year-to-date and DRAM has surged 166% since its April launch, making both funds acutely vulnerable to the Asia-driven chip selloff that wiped 5% off Japan's Nikkei and 6% off Taiwan's benchmark this week.
- Tech captured $13 billion of June's $17 billion in total sector ETF inflows — 78% of the total versus Tech's 45% share of sector assets — a crowded positioning that amplifies downside when macro sentiment flips.
- Watch whether SOXX holds its 50-day moving average and whether DRAM weekly inflows break their uninterrupted positive streak, which has run every week since the fund's April launch through at least July 3.
The most crowded trade in the ETF market just got its first serious stress test. SOXX — the iShares Semiconductor ETF — is up 113% year-to-date, and DRAM, the Roundhill Memory ETF launched in April, has returned 166% in roughly three months. This week, Japan's Nikkei slid 5% and Taiwan's benchmark lost 6% on chip-sector pressure and geopolitical headwinds. With ETF inflows having crossed $1 trillion at the halfway point of 2026, the question is no longer how much money came in — it's whether it stays.
How Concentrated the Bet Actually Is
The flow data tells a precise story about crowding. In June alone, the ETF industry took in $210 billion across all US-listed products. Of the $17 billion that flowed specifically into sector ETFs, $13 billion — 76% — went into technology. That share is dramatically above Tech's roughly 45% weight in total sector ETF assets, meaning investors weren't rebalancing toward tech in June. They were actively tilting into it at a pace that has no recent precedent. SOXX alone collected $4.1 billion in June, making it one of the top five individual fund winners for the month across all categories.
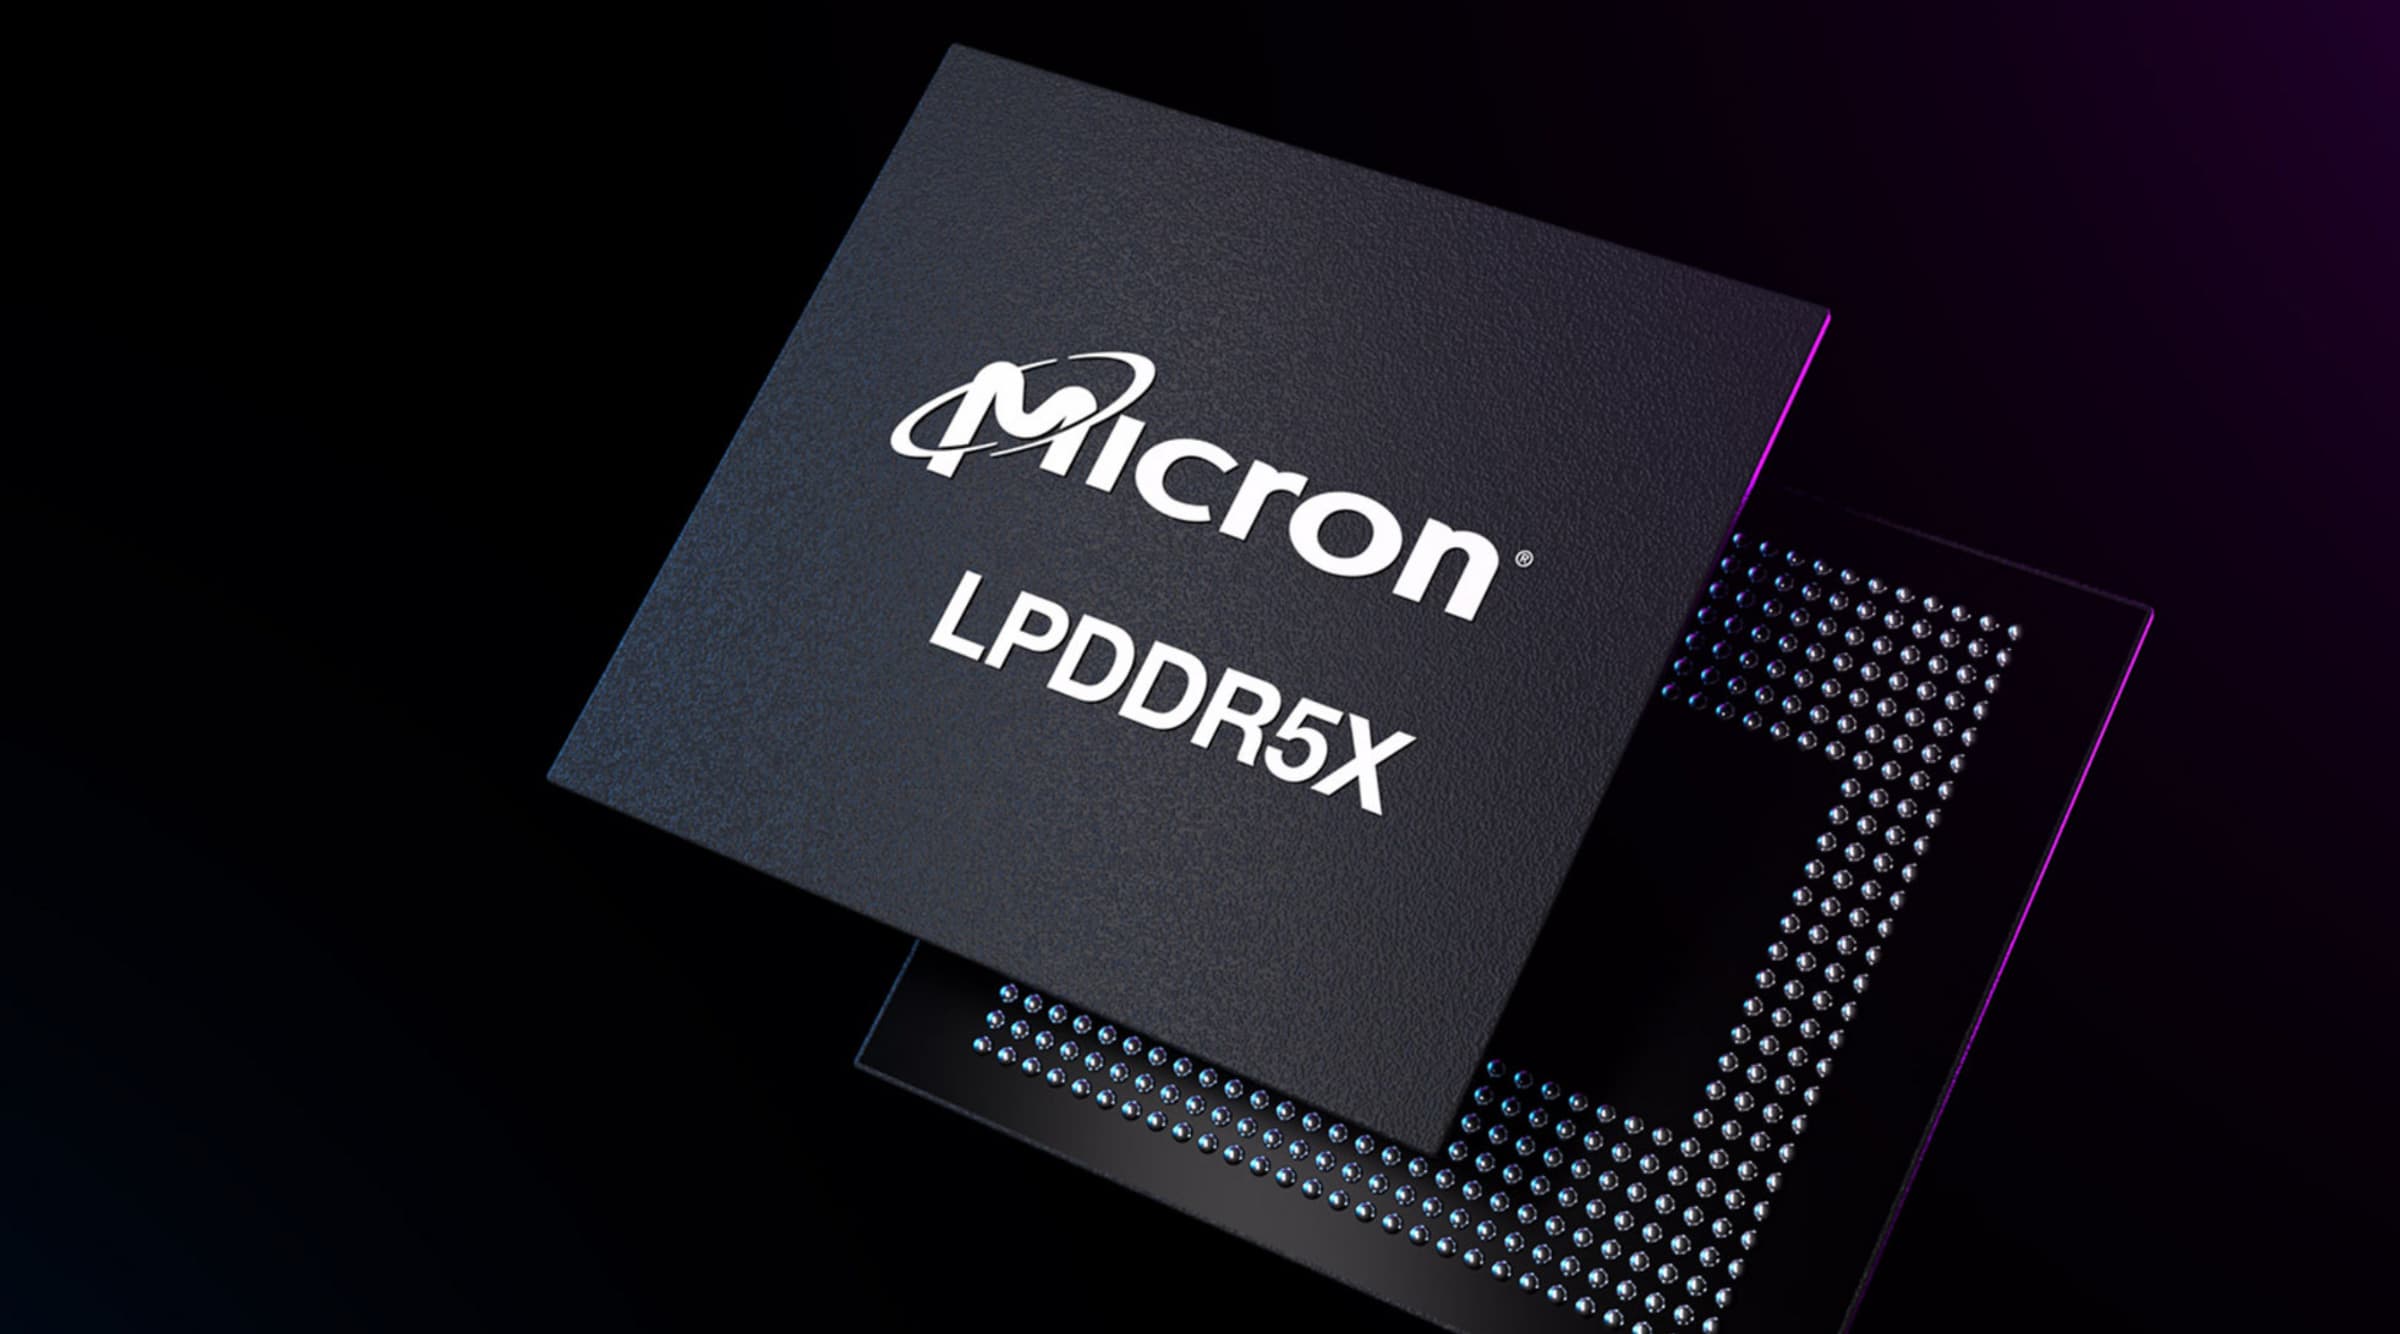
DRAM's story is even more extreme. The fund, which focuses exclusively on the high-bandwidth memory segment of the chip supply chain, pulled in nearly $10 billion in June and crossed $25 billion in assets — all in fewer than 90 days of existence. Its three largest holdings — SK Hynix, Samsung Electronics, and Micron — collectively control more than 90% of the global HBM market and accounted for over 70% of DRAM's exposure as of July 7. That means the fund is, in practical terms, a three-stock concentrated bet on the AI hardware buildout dressed in ETF packaging. Diversification within DRAM is largely cosmetic.
What the Asia Selloff Changes
The mid-week drop in Asian equity markets is not a minor technical event for US semiconductor ETF holders. Taiwan's exchange houses TSMC — the world's most critical chip fabricator and a core holding in both SOXX and most broad semiconductor indices — and when Taiwan's benchmark falls 6% in a single session, the spillover into US-listed semi ETFs is not abstract. SOXX tracks US-listed semiconductor companies, but the underlying earnings for most of those companies flow through Asian manufacturing and Asian end-demand. A geopolitical flare in the Taiwan Strait or a demand signal reversal from Korean memory makers lands directly in SOXX's net asset value.
The broader macro backdrop adds pressure rather than cushion. The 10-year Treasury yield stood at 4.55% as of July 15, and the 2-year was at 4.13% — a yield curve that has steepened 42 basis points but remains in territory that keeps the discount rate for long-duration growth assets elevated. Semiconductor stocks are among the most duration-sensitive equities in the market. When yields were falling, that sensitivity was a tailwind. At 4.55% on the long end with CPI still printing at 3.5% year-over-year as of June 1, that tailwind has not returned. The Fed Funds Effective Rate sits at 3.63%, and with core CPI at 2.6%, the Fed has limited room to cut aggressively — exactly the kind of environment where a crowded growth trade is most exposed to a sentiment reversal.
What Traders Should Watch This Week
The immediate technical focus for SOXX is whether inflows hold or reverse in the week ending July 18. DRAM posted positive inflows every single week from its April launch through July 3 — the first interruption of that streak would be a meaningful signal, not just a headline. Institutional flows tend to be stickier than retail, but at $25 billion in assets with a three-stock concentration profile, any large institutional redemption in DRAM has an outsized NAV impact because the underlying HBM names are not the most liquid equities in global markets. SK Hynix, in particular, trades on the Korea Stock Exchange, and a US ETF redemption cycle that forces the authorized participant to unwind Korean equity exposure adds a currency and liquidity layer to the exit that broad US equity ETFs don't face.
For SOXX, the 113% year-to-date gain means investors who entered in January are sitting on gains large enough to trigger tax-loss harvesting logic in reverse — meaning they have significant embedded gains that make holding psychologically easier but also create a larger drawdown magnitude if a stop is triggered. The best-performing index in the semiconductor space — the MSCI ACWI IMI Semiconductors & Semiconductor Equipment ESG Screened Select Capped — was up 100.63% year-to-date as of July 13, the day before the Asia selloff intensified. That number will look materially different by the time weekly flow data is compiled.
The forward-looking trade is straightforward: watch SOXX's weekly flow report for the period ending July 18, due from ICI and State Street in the following week. A net outflow reading — the first since February — would confirm that the Asia selloff triggered institutional repositioning, not just retail hesitation. The level to watch on SOXX is the February consolidation base near the $290 range, which represented the fund's last meaningful accumulation zone before the Q2 acceleration. A close below that level on elevated volume would shift the thesis from "healthy pullback in a bull trend" to "distribution phase in an overbought sector." With $1 trillion in net new ETF money deployed in 2026 and 78% of sector flow concentrated in tech, the margin for error is thin.
The Weekly Investor
Daily market analysis for active traders. Free.