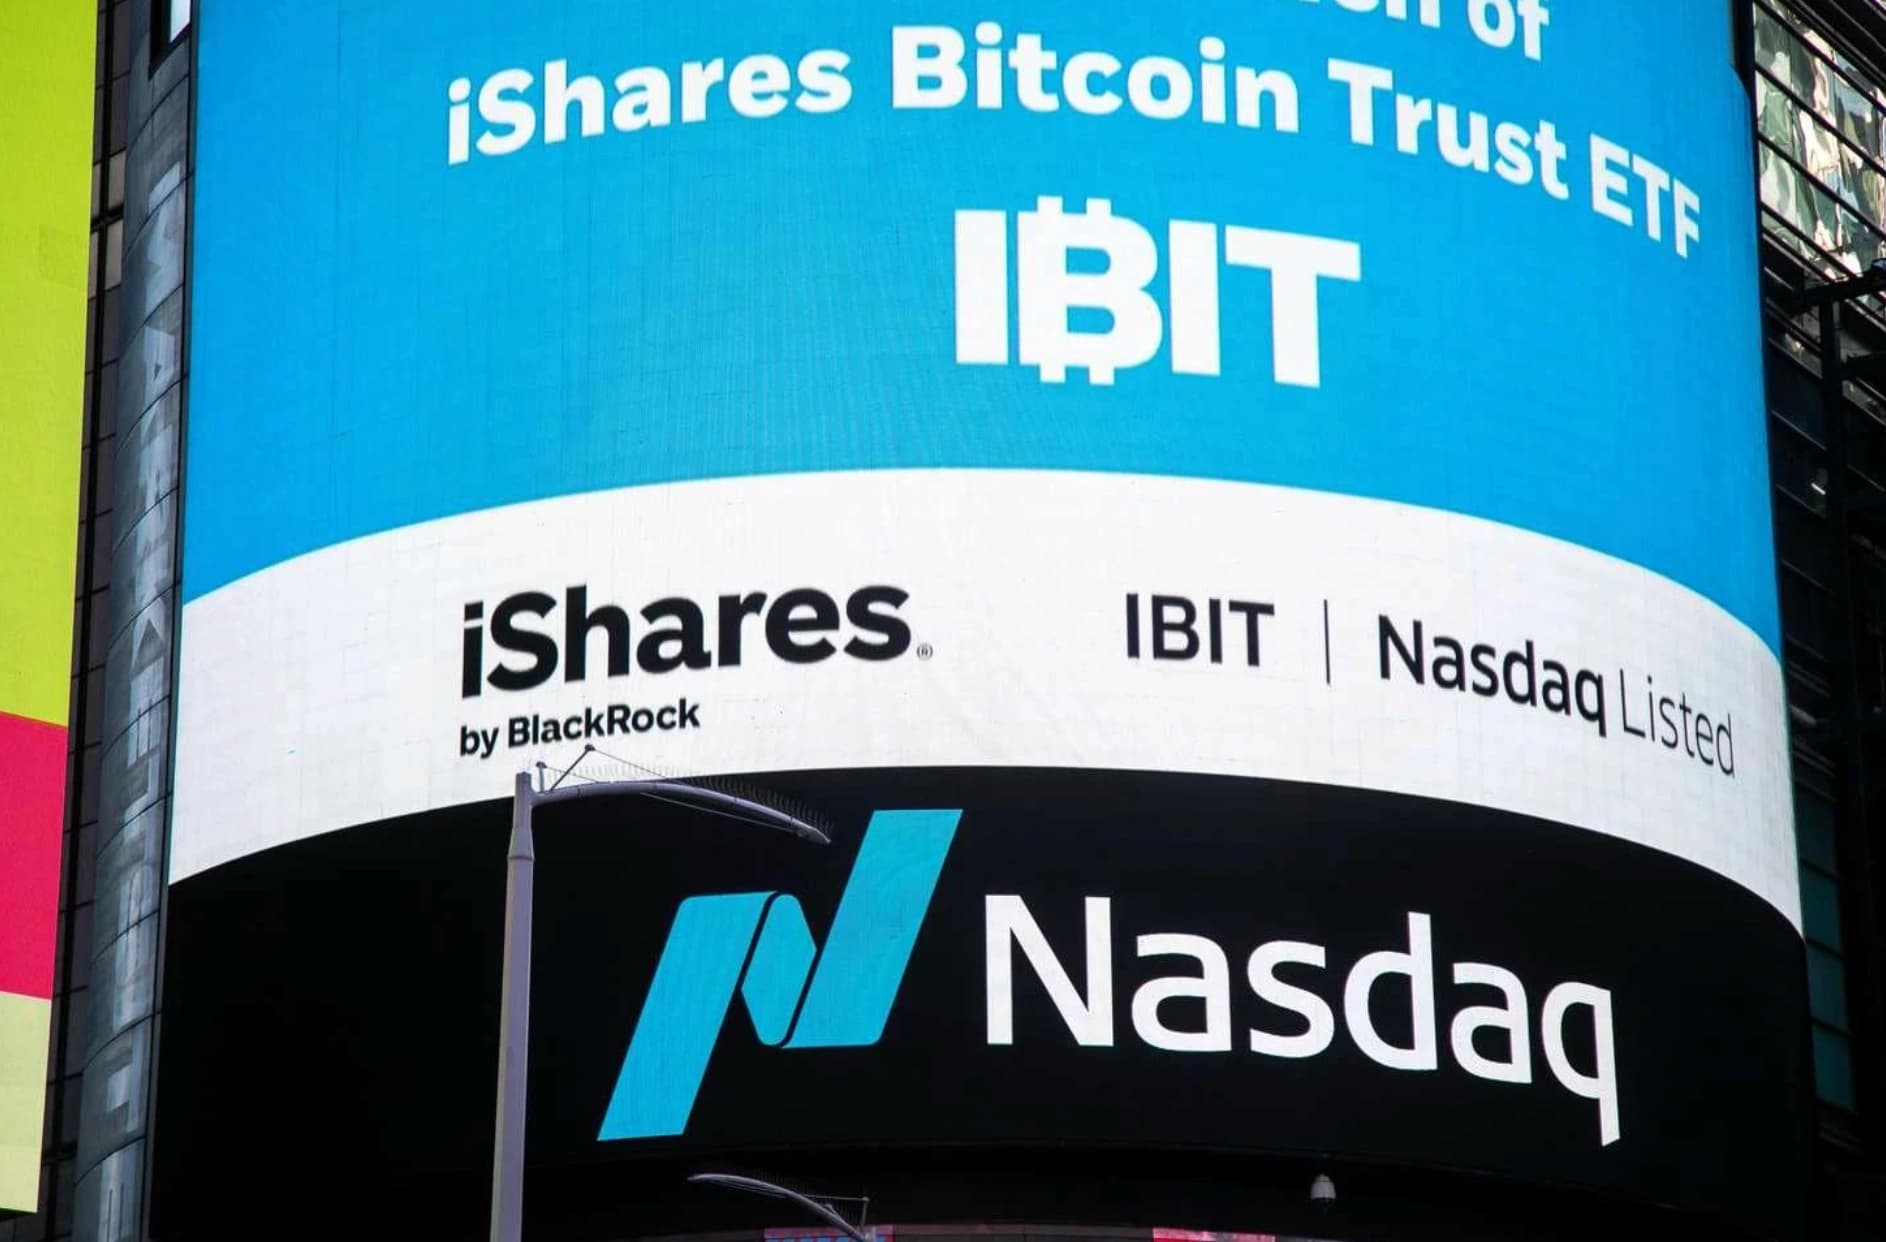
Bitcoin ETFs Hit $727M 5-Day Streak; Ether Joins
Spot bitcoin ETFs logged $227M on July 20, completing a five-day $727M inflow streak — the first since April. ETHA led ether funds with $34M.
Key Points
- U.S. spot bitcoin ETFs logged approximately $227 million in net inflows on July 20, completing a five-consecutive-day streak totaling $727 million — the first such run since late April.
- The inflow streak has lifted total bitcoin ETF assets from a July low near $75 billion back to roughly $79 billion, reversing the worst of the June outflow damage.
- The Fed's July 28–29 meeting is the next macro trigger — a dovish signal on rates could extend the crypto ETF bid, while a hawkish surprise at 4.55% on the 10-year would test whether this streak has legs.
U.S. spot bitcoin ETFs took in **$227 million on July 20**, locking in a fifth consecutive day of net inflows — the first five-day streak since late April — and bringing the running five-session total to **$727 million**, per SoSoValue data. That's not a number that moves long-term macro needles, but in the context of a category that bled assets through most of June, it marks the clearest sign yet that institutional and retail buyers are returning to the trade at current price levels.
From $75 Billion to $79 Billion in Five Sessions
The speed of the recovery matters as much as the magnitude. Total bitcoin ETF assets hit a July low near **$75 billion** before this inflow streak began — a decline driven by a period of sustained net outflows that represented one of the worst redemption runs the category has seen since the January 2024 launch of the first U.S. spot products. Five sessions of consistent buying have pushed that figure back to approximately **$79 billion**, a **$4 billion recovery** in under two weeks. That pace of asset rebuild — roughly $800 million per day in combined inflow and price appreciation — suggests the marginal buyer at these levels is not a momentum chaser. It more likely reflects systematic rebalancing, tactical re-entry by funds that trimmed during the June volatility, or both.
**BlackRock's iShares Ethereum Trust (ETHA)** led the ether side of the ledger on July 20 with approximately **$34 million** in net inflows, out of a combined **$38 million** across all spot ether ETFs. That $38 million single-day figure is modest relative to the bitcoin ETF category's $227 million, but the ETHA-to-total ratio tells an important story: BlackRock is capturing the overwhelming majority of ether ETF flows, continuing a dominance pattern that has persisted since the ether ETF category launched. Competing ether products are largely fighting over the remaining $4 million, which raises a structural question for traders holding non-BlackRock ether ETF positions about long-term liquidity and spread risk.
The broader June ETF flow environment offers useful context. Investors poured **$210 billion** into U.S.-listed ETFs in June — the second-best month on record at $191 billion net when measured against historical ICI data — but crypto ETFs were not a primary driver. Commodities bled **$6 billion** and currency ETFs shed **$4.6 billion**. The dominant flows went to U.S. equity (**$103 billion**), fixed income (**$46 billion**), and international equity (**$37 billion**). Crypto's June numbers were negative within that context, which makes the current five-day reversal more notable: it's occurring against a backdrop where the prior month's flows actively moved in the other direction.
The Rate Backdrop Crypto ETF Buyers Are Betting Against
At **4.55% on the 10-year Treasury** and a Fed funds rate of **3.63%** as of July 17, the rate environment is not obviously constructive for risk assets with no yield. Bitcoin ETF inflows happening at these levels represent a deliberate allocation decision — buyers are choosing a zero-yield, high-volatility asset over a 10-year at 4.55% or a 2-year at 4.18%. That's not irrational if the thesis is that the Fed is heading lower and real yields will compress, but it does mean the crypto ETF trade is implicitly a rate-cut bet as much as a crypto-specific one.
CPI at **+3.5% year-over-year** and core at **+2.6%** give the Fed limited room to move aggressively, but the SOFR rate sitting at **3.59%** — very close to the effective Fed funds rate of 3.63% — suggests money markets are not pricing in imminent tightening either. The curve has steepened modestly: the 10-year at 4.55% versus the 2-year at 4.18% represents a 37-basis-point positive slope, a structural shift from the inversion that characterized most of 2023 and 2024. For crypto ETF positioning, a steepening curve in a declining-rate environment has historically been associated with risk-on rotations that include digital asset exposure. The current five-day inflow streak may be an early expression of that dynamic.
The broader H1 2026 context for active and thematic ETFs reinforces the point that capital is still moving aggressively into higher-conviction, higher-risk strategies. Actively managed ETFs pulled in roughly **$350 billion** in the first half of 2026, including nearly **$200 billion** in Q2 alone — the best half on record for the category. Leveraged products took **$15 billion** in June alone. The risk appetite in the ETF market broadly is elevated, and crypto ETFs — despite their June stumble — are positioned to recapture flows within that environment if macro conditions cooperate.
What the Fed Meeting Means for the Next Streak
The July 28–29 FOMC meeting is the single most important near-term catalyst for crypto ETF flows, more so than any individual bitcoin price level. If the Fed delivers a dovish hold — keeping rates steady while signaling readiness to cut in September — the combination of a declining rate path and elevated risk appetite could extend the current inflow streak well beyond five days. The bitcoin ETF category went from near-zero assets to **$79 billion** in roughly 30 months; at this pace of institutional adoption, even a modest re-acceleration of inflows could push the category toward **$90 billion** in assets by year-end if the rate backdrop cooperates.
The risk scenario is less complicated but more painful. A hawkish surprise from the Fed — driven by CPI stubbornness at 3.5% — would put the 10-year back above 4.7% territory and likely trigger another round of crypto ETF outflows as risk appetite contracts. The June redemption episode showed how quickly the $75 billion floor can be tested. Traders running long positions in bitcoin ETFs this week should treat the July 28 Fed statement as the binary event it is, with the current five-day streak representing positioning ahead of that print rather than a confirmation that the outflow cycle is definitively over. SoSoValue's daily flow tracker will be the first data source to reflect post-FOMC positioning shifts — watch the July 29 inflow or outflow figure as the cleanest read on how institutional crypto ETF allocators interpreted the Fed's message.
The Weekly Investor
Daily market analysis for active traders. Free.