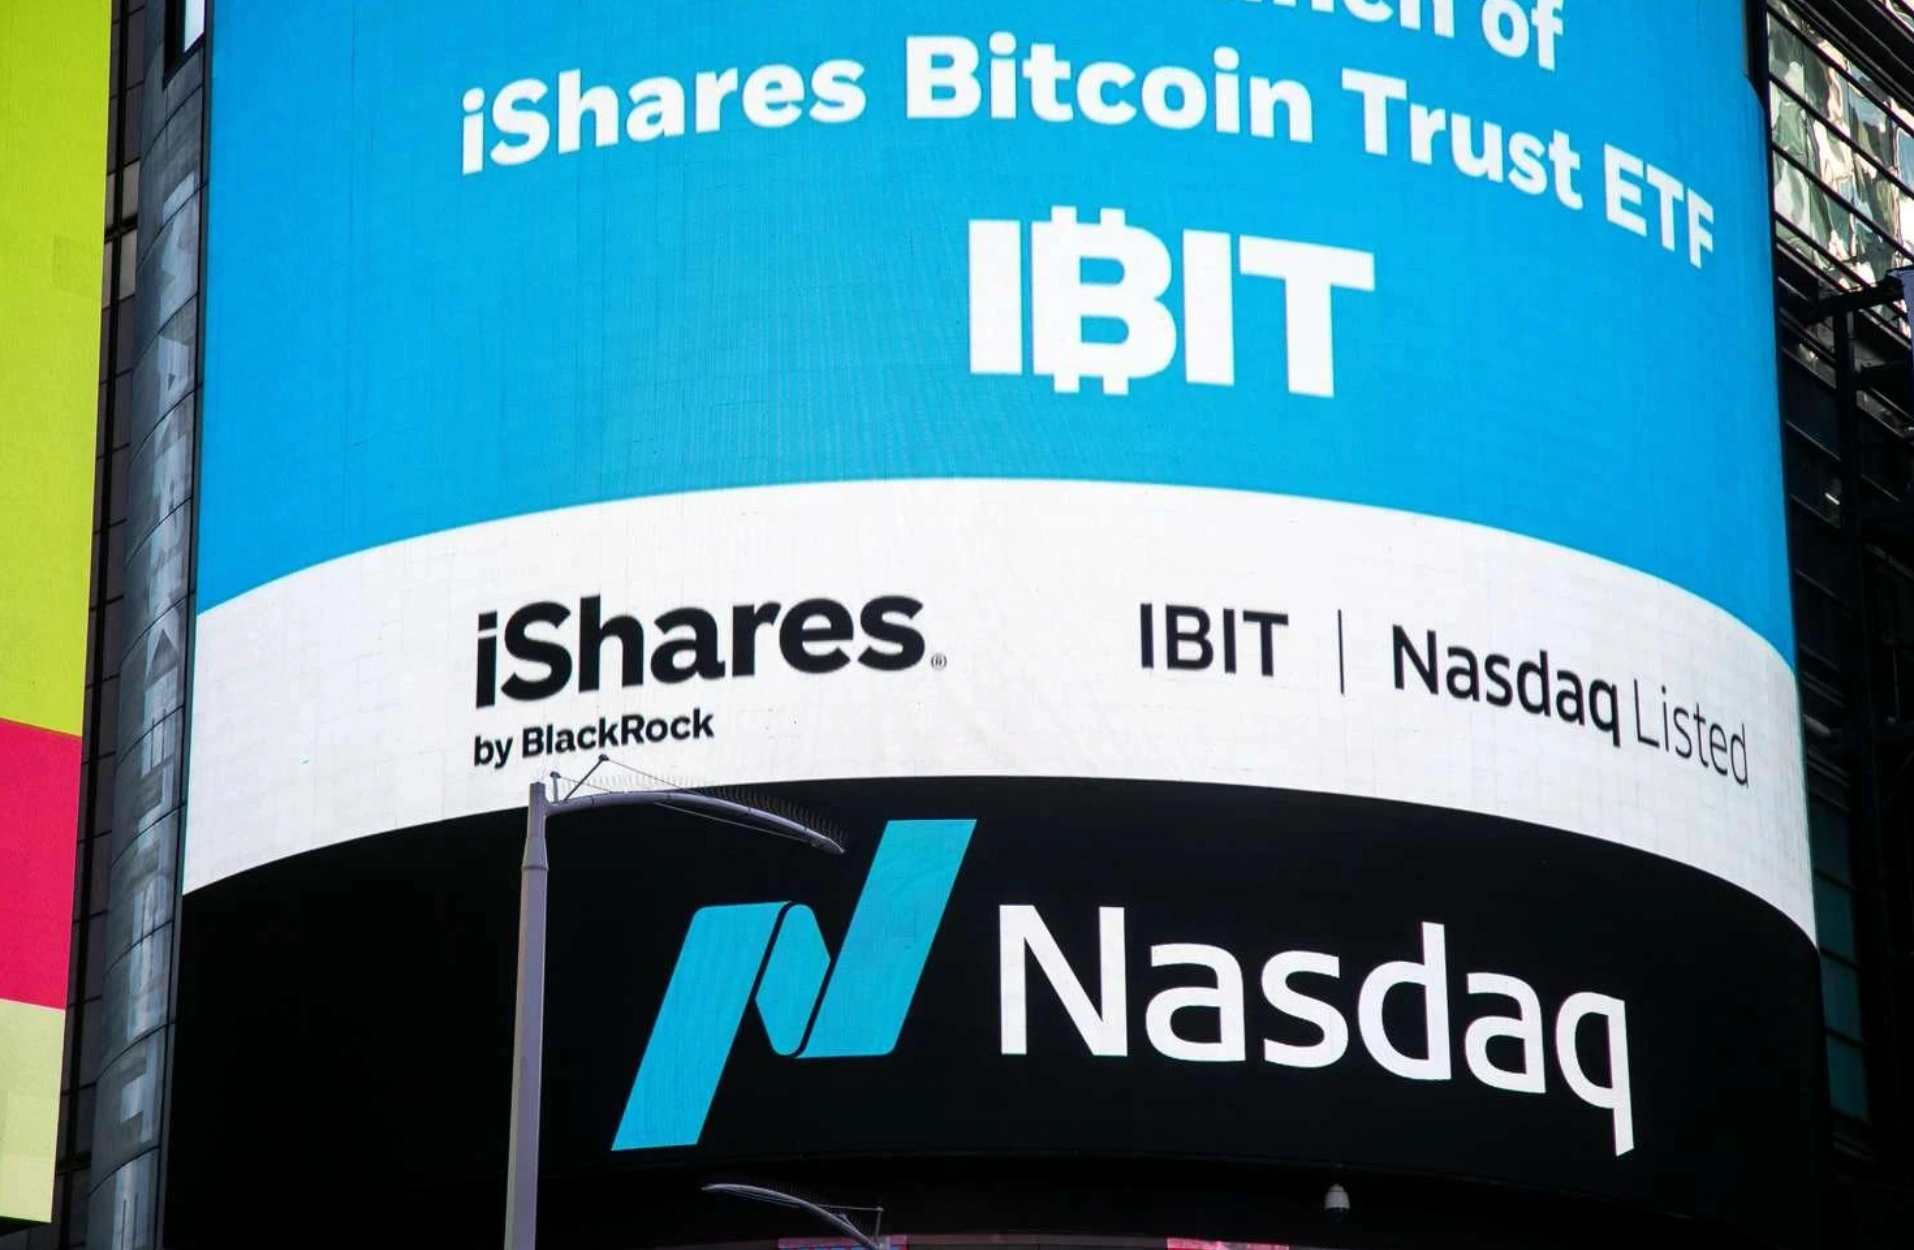
Bitcoin's $999M ETF Day: A Streak Not Seen Since 2012
Bitcoin surges to $86,600 on a record $999M single-day ETF inflow — and a three-month winning streak last seen in 2012. Here's what traders watch next.
Key Points
- Bitcoin pulled in a record $999M in single-day spot ETF inflows on September 23, triggering a rally to $87,395 — the highest print in 30 days.
- A three-month winning streak spanning July (+4.8%), August (+25.2%), and September (+10.9%) has occurred only once before in Bitcoin's history, in 2012.
- Traders should watch the $87,000–$90,000 resistance band; a close above $87,395 opens the door toward $90,000, while a break of $78,500–$80,000 support revives the correction thesis.
A record $999M poured into Bitcoin spot ETFs on Tuesday — the largest single-day inflow ever recorded, per CoinMarketCap — and the market responded immediately, printing $87,395 and clearing resistance that had capped rallies for weeks. BTC is now trading at $86,600, up 1.5% in 24 hours and 15% from the $75,756 print just seven days ago. That weekly move is the story behind the story.
A Streak Only 2012 Has Seen
Bitcoin has gained in July (+4.8%), August (+25.2%), and is on track to close September higher — currently up 10.9% at $86,140. That three-month consecutive gain, over those exact three calendar months, has happened exactly once before in Bitcoin's 17-year trading history: in 2012, when BTC posted gains of 41%, 6.4%, and 24.4% across July, August, and September. CoinDesk flagged the 2012 analog this morning, and any trader reaching for the bullish parallel needs to sit with what came next: October 2012 broke the streak with a -9.7% monthly loss.
That historical footnote is not an argument for selling. It is an argument for precision. The current 30-day average sits at $79,235, meaning BTC is trading nearly 10% above its own recent mean — stretched, but not detached. The 52-week range runs from $57,832 to $126,186; the all-time high of $126,210 was set on October 6, 2025, and BTC is 31% below that peak. Bulls have a long runway if structural flows continue. Bears have a credible analog if momentum stalls at resistance.
The technical setup today is clean. Immediate support sits between $78,500 and $80,000 — a zone that, if breached, reopens the short-term correction thesis in a meaningful way. Resistance clusters between $87,000 and $90,000, with today's intraday high of $87,363 representing the best 30-day print and the line that matters most for the next 48 hours. The session is currently printing in a tight $86,149–$86,790 range as buyers consolidate the morning's ETF-driven surge.
What $999M in One Day Actually Means
To understand why today's ETF print matters, consider the context: yesterday's session (September 22) saw $714.75M in Bitcoin spot ETF inflows, itself a strong number. The jump to $999M in a single day represents a 40% acceleration in institutional demand in less than 24 hours. Year-to-date, crypto ETFs have now surpassed $1.5 trillion in cumulative 2026 inflows with three months still remaining — a structural shift in how capital accesses this asset class that was essentially impossible before 2024.
Franklin Templeton now offers Bitcoin, Ethereum, XRP, and Solana ETFs alongside a Crypto Index ETF. Its Bitcoin ETF held approximately $421M in net assets as of September 15. The SEC approved T. Rowe Price's actively managed crypto ETF in June 2026 — a product designed around long-term capital growth rather than passive single-asset exposure — and regulators are currently reviewing leveraged Bitcoin and Ethereum structures with higher daily exposure limits. The product landscape is expanding faster than most retail traders have absorbed.
Strategy's recent moves underscore the institutional conviction. The firm purchased 950 BTC for approximately $75.7M between September 14–20, averaging into weakness at a cost basis near $79,684 per coin — well below where BTC trades today. That follows an earlier purchase of 13,267 BTC for roughly $1.25B when BTC was near $95,000. Strategy is underwater on that earlier tranche by approximately 9%, which means there is a known institutional seller absent from the market for now — a dynamic that historically reduces overhead supply at key resistance levels.
What Traders Watch Next
The CLARITY Act is dead. The Senate killed the primary crypto market structure bill 49–50, removing it from the near-term legislative calendar. What is notable — and what the market priced emphatically — is that BTC gained 14% after that vote. Regulatory risk in crypto does not operate linearly; the absence of framework has not prevented record ETF inflows, institutional accumulation, or a historic three-month streak. The market has learned, at least provisionally, to trade through Washington.
The next catalyst with real price implications is the September FOMC dot plot. The federal funds target range currently sits at 3.50–3.75%, held at the July meeting on a 9–3 vote. Any signal of a more aggressive easing path than markets currently price would be directionally constructive for BTC, which has attracted Swiss institutional capital explicitly as a hedge against $40 trillion in U.S. debt, per Neoclassic Capital's Bucella. Gold, franc, and BTC are the trio drawing that particular flow — and BTC is the most liquid, most volatile, and most ETF-accessible of the three.
Coinbase Derivatives' CFTC filing to launch cash-settled perpetual futures tied to individual U.S.-listed stocks and ETFs is worth watching as a secondary signal. If approved, it extends the institutional infrastructure around crypto derivatives in a direction that has historically preceded broader market deepening and, eventually, higher open interest and price discovery. X's Cashtag Partner Program — linking $BTC tickers directly to live charts and trade buttons on Coinbase — lowers friction for retail engagement at exactly the moment institutional flows are accelerating.
The specific level that defines the next week: $87,395, today's high. A daily close above that number — on volume consistent with or exceeding Tuesday's ETF-driven print — would constitute a technical breakout with the $90,000 handle as the next logical target. Failure to close above $87,000 twice in succession, with the 30-day average at $79,235 pulling like gravity, sets up a retest of the $83,000–$85,000 range that preceded this week's surge. October 2025 made the all-time high. October 2012 broke the streak. October 2026 gets its verdict in eight days.
The Weekly Investor
Daily market analysis for active traders. Free.