
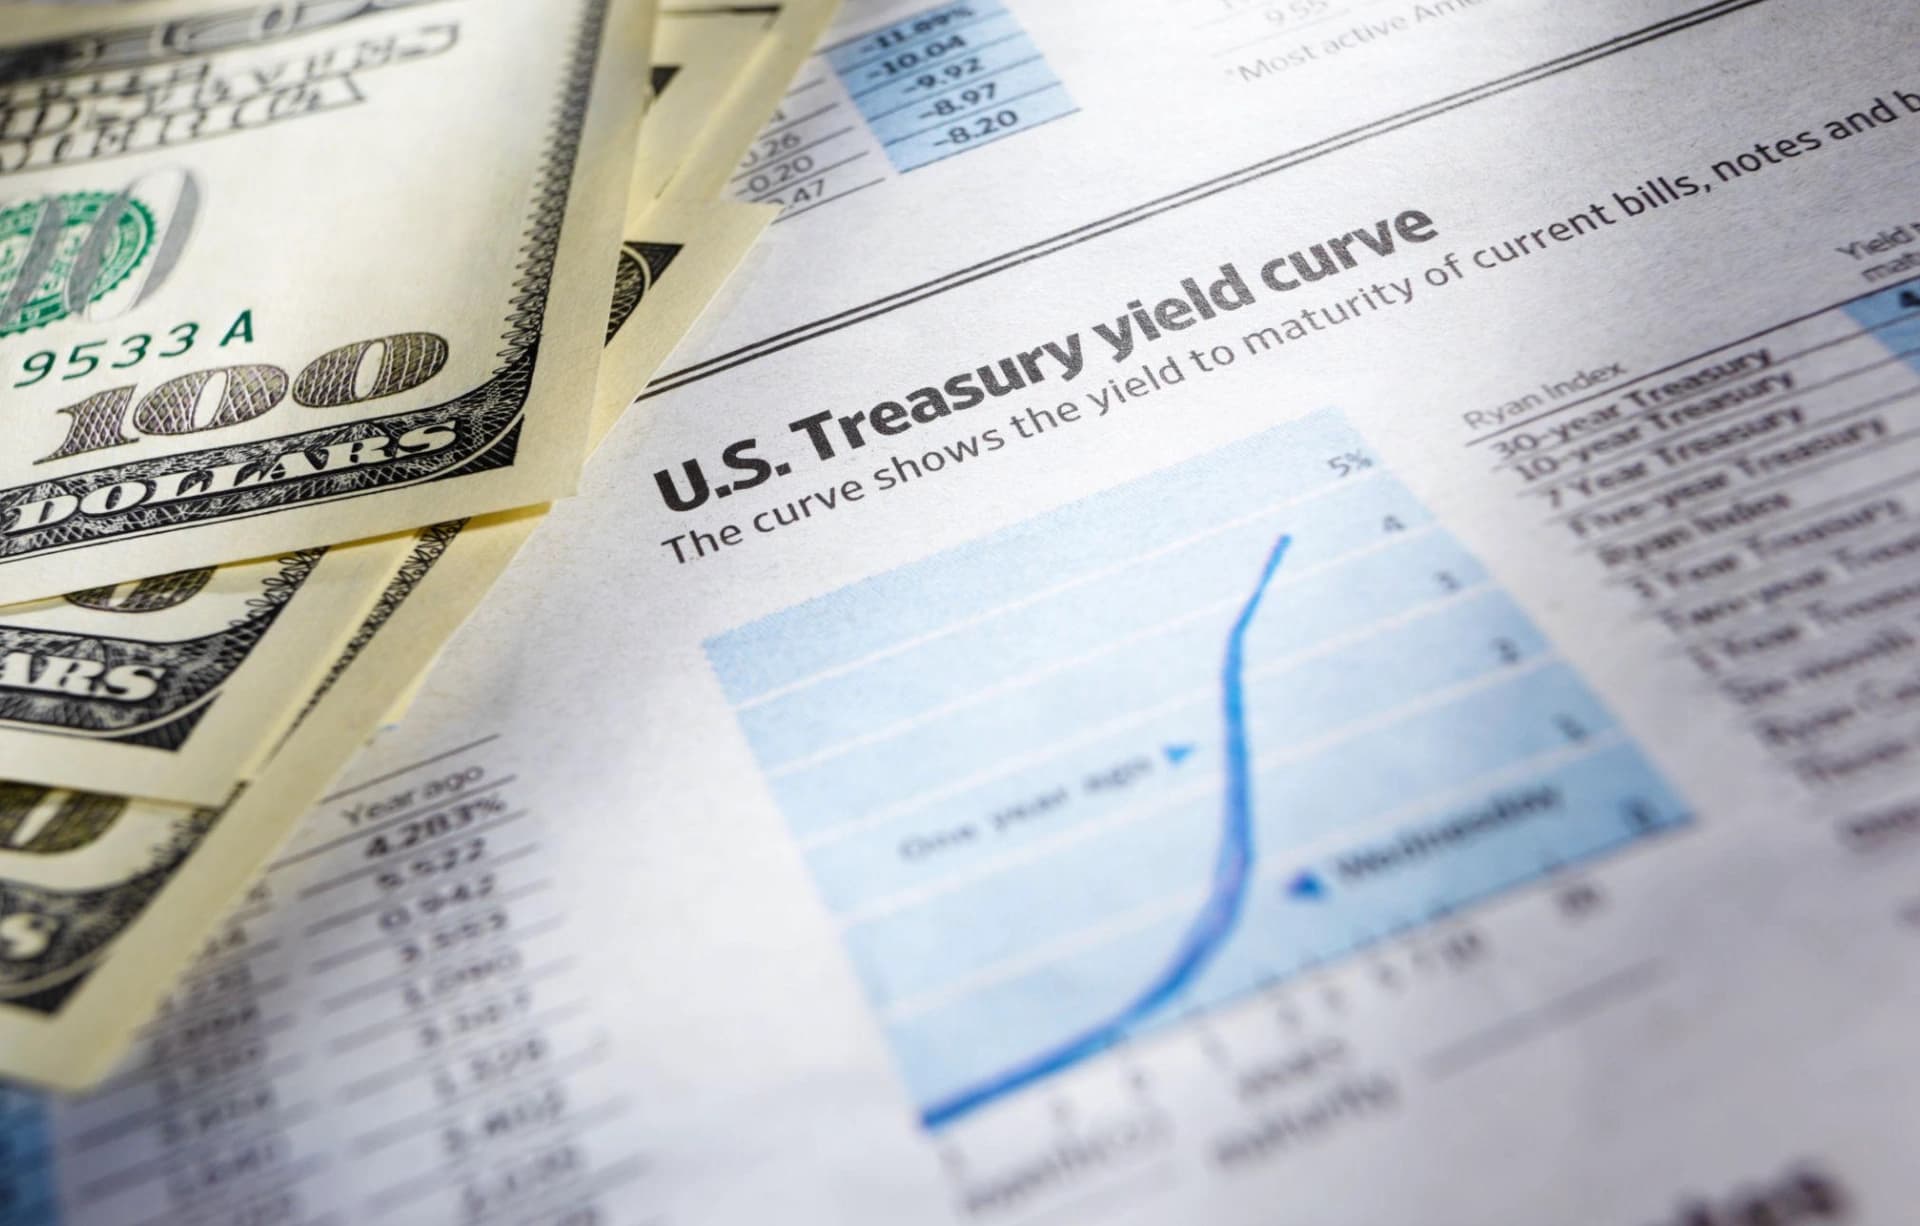
Yield Curve Turns Positive: What the 47bp Spread Signals
The 10-year Treasury at 4.64% vs. the 2-year at 4.17% produces a 47bp positive spread — a macro signal traders can't afford to ignore heading into September.
Key Points
- The 10-year Treasury yield at 4.64% versus the 2-year at 4.17% produces a 47-basis-point positive spread — a structural shift after an extended inversion that carries specific implications for banks, credit, and risk assets.
- A bear steepener dynamic — both yields rising but the long end rising faster — signals that the bond market is pricing duration risk and fiscal concerns, not just Fed path changes.
- The September 16 FOMC and September 11 CPI are the catalysts most likely to determine whether the curve steepens further or mean-reverts toward flat.
The U.S. yield curve is no longer inverted, and that fact alone changes the macro playbook for the remainder of 2026. As of August 25, the 10-year Treasury yielded 4.64% against the 2-year's 4.17% — a 47-basis-point positive spread that marks a meaningful structural shift. The conventional wisdom is that disinversion is bullish. The actual history is more complicated, and the type of steepening matters enormously for how traders should position across equities, credit, and rate-sensitive sectors.
A Spread That Misleads If Misread
Not all yield curve steepening is the same, and the current configuration has fingerprints of a bear steepener rather than a bull one. In a bull steepener, short rates fall faster than long rates — typically because the Fed is cutting or is expected to cut, and bond markets rally at the front end. In a bear steepener, both yields move higher but the long end accelerates, driven by fiscal concerns, term premium expansion, or markets pricing in persistent inflation. With the effective federal funds rate at 3.63%, SOFR at 3.66%, and the 2-year at 4.17%, the front end is already pricing in a modest spread above the policy rate — roughly 54 basis points above EFFR. That is a market that sees some, but not dramatic, tightening risk on the near-term horizon.
The long end is the telling part. A 10-year at 4.64% with core PCE running at approximately 3.2% year-over-year implies a real yield of roughly 144 basis points on the 10-year. That is not historically extreme, but it is meaningfully positive — a level that creates genuine competition for equities at current valuations. Every additional basis point the 10-year adds compresses the equity risk premium on a market that has priced in a soft landing with considerable optimism. The bear steepener scenario, where the 10-year pushes toward 4.80% or 5.00% on a hot September 11 CPI print, is the tail risk that rate-sensitive equity sectors cannot absorb without re-rating.
The fiscal dimension is underappreciated by traders focused exclusively on the Fed path. The United States has been running deficits that require sustained Treasury issuance at the long end, and foreign buyer appetite — particularly from Japan, whose own monetary policy has shifted meaningfully over the past 18 months — has become less reliable at absorbing that supply. Term premium, the extra yield investors demand for holding long-duration paper rather than rolling short-term bills, had been compressed to near-zero or negative for years. Its return to positive territory is the structural story underneath the specific FOMC narrative. Even if the Fed holds in September, even if CPI softens, the long end can continue to drift higher if term premium keeps expanding — and that possibility makes TLT a structurally challenged asset regardless of what the Fed does on September 16.
What Banks and Borrowers Feel First
A positively sloped yield curve is mechanically good for bank net interest margins — institutions borrow short and lend long, and a steeper curve widens the spread on that fundamental trade. Banks that have been squeezed by the inverted curve for the better part of two years should, in theory, see margin recovery as the 10-year/2-year spread widens toward and beyond 50 basis points. But the current environment complicates that straightforward read in two ways. First, deposit competition remains intense: with SOFR at 3.66%, money market funds are still paying rates that pull deposits away from bank balance sheets, limiting the benefit of wider spreads on the asset side. Second, credit quality is the variable that steepening-as-recovery narratives consistently underweight.
Unemployment at 4.1% is benign, but Q2 GDP grew at just 1.5% annualized — a meaningful deceleration from Q1's 2.1%. If growth continues to slow toward 1.0% in Q3, the credit cycle dynamics that follow curve steepening become less about margin expansion and more about loss provisioning. History is unambiguous on this point: the 12–18 months following a yield curve disinversion are frequently when credit losses materialize, not when they peak. Banks pricing loan books against a 10-year at 4.64% are underwriting into a growth environment that is slowing, an unemployment rate that could tick up, and a consumer whose real PCE growth in July was effectively zero.
The energy complex adds an inflationary kicker that the curve is already partially absorbing. WTI crude at $87.35 per barrel and Brent at $94.20 — levels current as of August 21 — are embedding energy price pressure that flows through to headline CPI with a lag of roughly six to eight weeks. If crude holds at current levels or pushes higher into September, the September 11 CPI print will have a larger energy component than the market's base case, which currently leans toward a soft headline number. That outcome — energy-driven CPI surprise — is the specific scenario that could push the 10-year through 4.75% and widen the spread to 60 basis points or more by month-end, while simultaneously forcing bond markets to re-examine the dovish pricing embedded in the 2-year.
What Traders Watch Next
The September 16 FOMC will not resolve the curve's trajectory on its own. The more important variable is the statement's language around future meetings — specifically, whether the three dissenters (Hammack, Kashkari, Logan) narrow their margin for a hike or whether the majority signals that the 3.50%–3.75% range is a ceiling rather than a midpoint. A hawkish hold — maintaining rates but explicitly leaving the door open for a November hike — would likely steepen the curve further as the 2-year reprices higher while the 10-year adds term premium on top of that. A genuinely dovish hold — language suggesting the next move is a cut — would rally the 2-year, compress the spread, and provide relief to rate-sensitive equity sectors.
The specific levels to watch: a 10-year above 4.75% puts real pressure on equities trading at stretched multiples; a 2-year above 4.40% prices in a material probability of a November hike and would be the clearest signal that the three-dissent story is metastasizing into majority hawkishness. On the downside, a 10-year that fades below 4.50% on soft September 11 CPI would confirm the bull steepener reading — short rates anchored by hold expectations, long rates easing on disinflation confidence — and that outcome is materially more constructive for duration assets like TLT and for growth equity valuations. The 47-basis-point spread is not a verdict. It is a question the next two weeks will answer.
The Weekly Investor
Daily market analysis for active traders. Free.


