
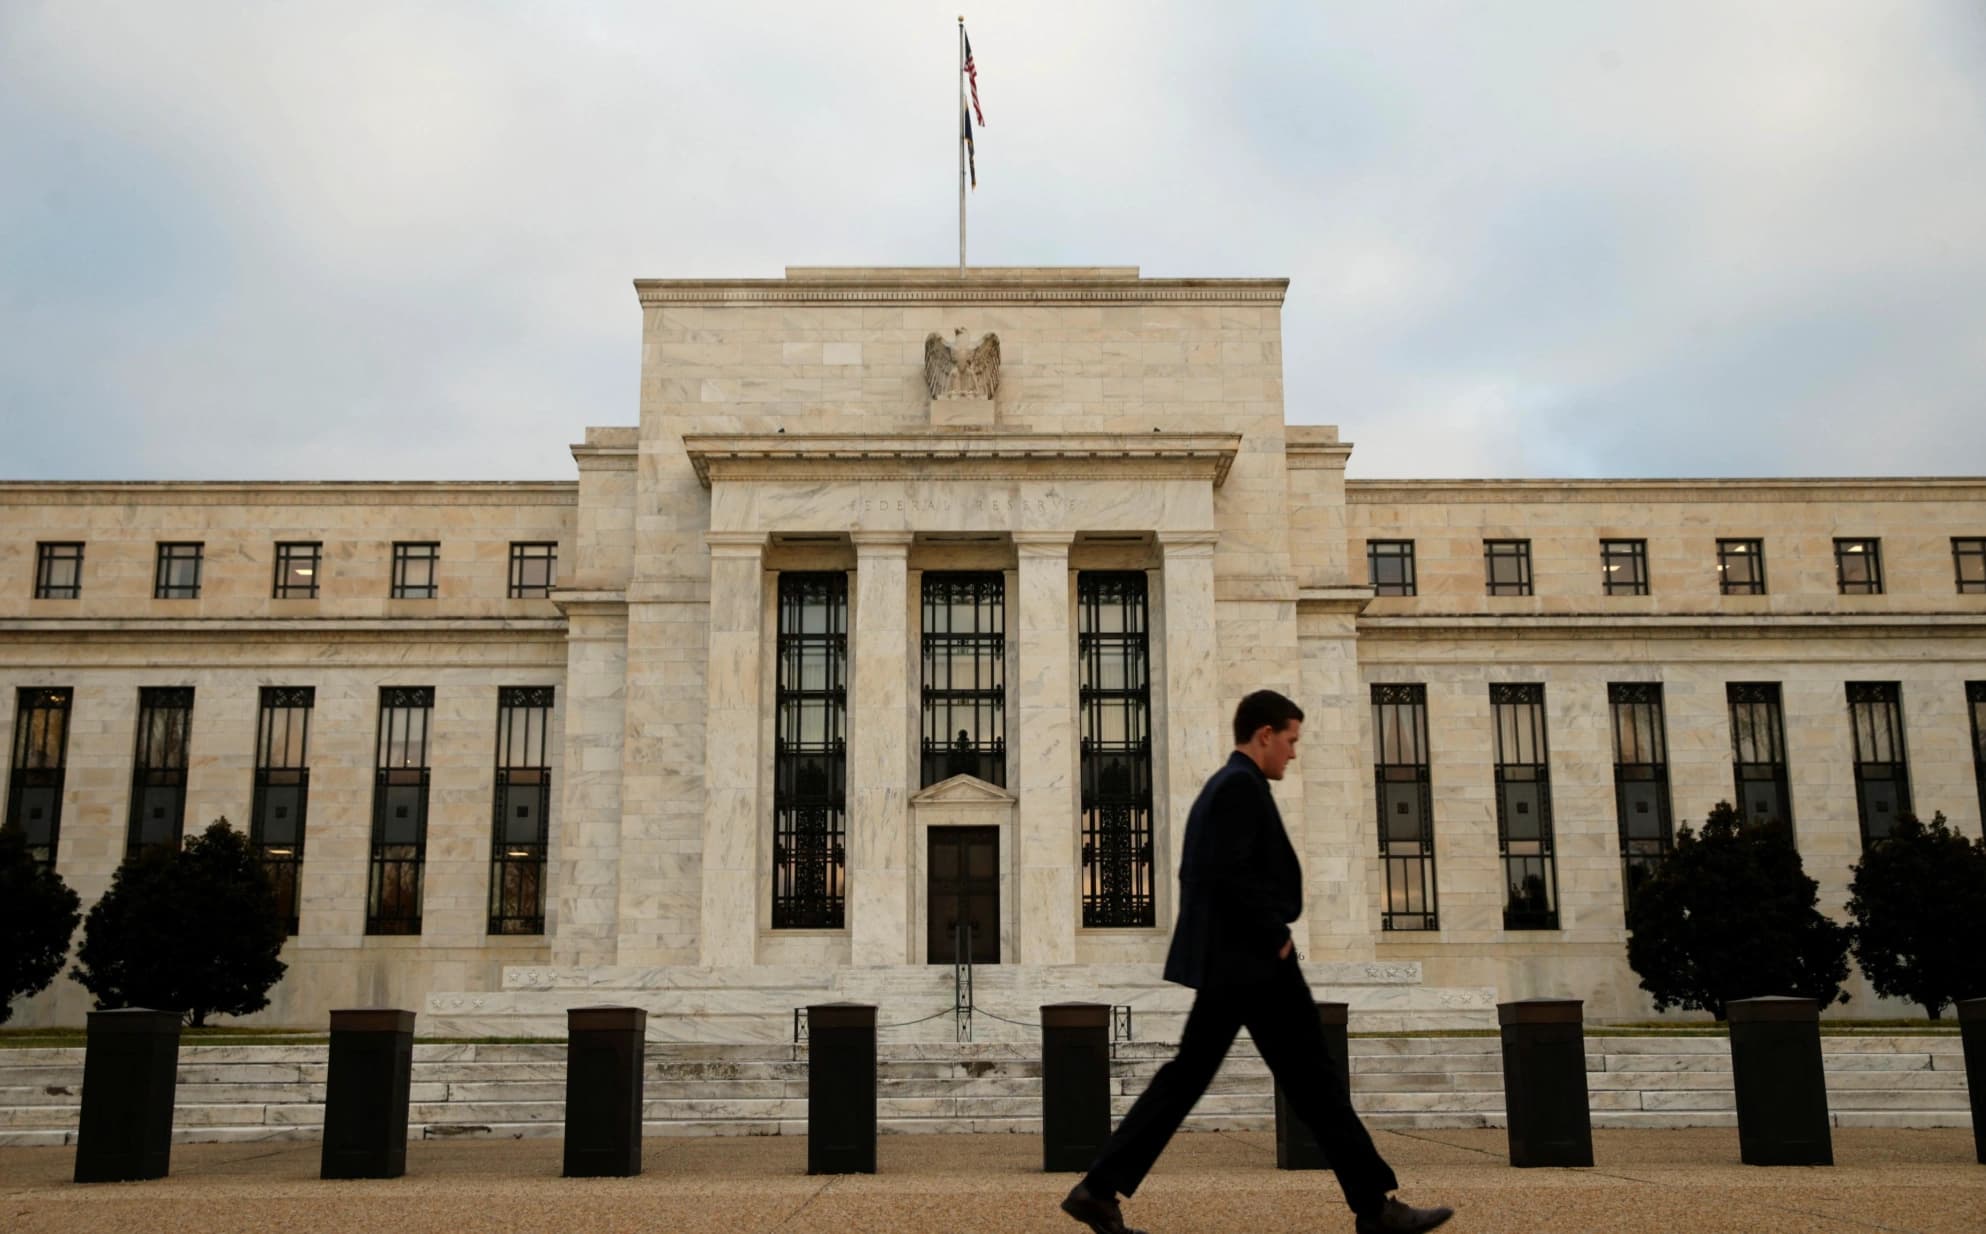
Yield Curve Turns Positive as Rate Hike Risk Returns in 2026
The 10-year Treasury at 4.66% and 2-year at 4.19% signal a 47-basis-point positive spread — and what it means for traders heading into September's FOMC.
Key Points
- The 10-year Treasury yield at 4.66% versus the 2-year at 4.19% produces a 47-basis-point positive spread — a curve that has been re-steepening on rate hike risk, not rate cut hope.
- The 30-year yield hit 5.31% on August 17, its highest since 2007, forcing a rare Treasury Department bond market intervention on August 19.
- September CPI on September 11 and the FOMC decision on September 16 are the next two events that can structurally shift where the long end trades.
The U.S. Treasury yield curve is no longer inverted — and that is not the relief rally bond bulls were waiting for. The 10-year yield closed Wednesday at 4.66% against a 2-year at 4.19%, producing a 47-basis-point positive spread that is being driven not by rate cut expectations pulling the short end down, but by term premium and inflation anxiety pushing the long end up. For traders positioned in rate-sensitive assets, the distinction matters enormously.
How the Curve Got Here
A year ago, the yield curve inversion was the central preoccupation of macro traders — the 2-year yielding more than the 10-year was the textbook recession signal, and everyone was waiting for the disinversion to confirm either a soft landing or a hard one. What has happened instead is more complicated and in some respects more dangerous for fixed income positioning. The curve has disinverted not because the Fed cut rates aggressively and pulled the 2-year down, but because the long end has sold off hard on inflation persistence, fiscal supply concerns, and geopolitical risk premium tied to the Iran conflict.
The 30-year Treasury is the clearest evidence of that dynamic. It hit 5.31% on August 17 — the highest reading since 2007, before the global financial crisis restructured the entire interest rate landscape. That move was not the result of a single catalyst; it was the accumulation of months of above-target inflation readings, a federal deficit that continues to require heavy Treasury issuance, and an oil market that has kept Brent crude at $94.20 per barrel. The Treasury Department's decision to intervene in the bond market on August 19 — two days after the 5.31% print — underscores just how seriously the fiscal authorities view the situation. Treasury market interventions of that kind are not standard operating procedure; they are reserved for moments when the cost of long-term government borrowing is seen as threatening broader economic stability.
The effective federal funds rate at 3.63% and SOFR at 3.64% are both consistent with the current 3.50%-to-3.75% target range — overnight money markets are anchored and functioning. The tension is entirely in duration. Investors holding 10-year and 30-year Treasuries are being asked to accept yields that are historically elevated by post-2008 standards, but are doing so against a backdrop where a Fed that has seen three of its own members dissent in favor of raising rates is now sitting at Jackson Hole with a new chair who has not yet defined his reaction function publicly.
What Term Premium Is Telling You
Term premium — the extra yield investors demand for locking up capital in long-duration bonds rather than rolling short-term paper — has expanded materially in 2026. The New York Fed's ACM model, which decomposes nominal yields into expected short rates and term premium components, has shown term premium moving back into significantly positive territory as inflation expectations have drifted higher and fiscal uncertainty has compounded. The practical implication for traders is that the 10-year yield at 4.66% is not simply a mathematical output of where markets expect the fed funds rate to average over the next decade — it is also carrying a meaningful inflation and supply risk premium that did not exist at this magnitude two years ago.
Core PCE at 3.3% for July is 130 basis points above the Fed's 2% target. Headline CPI at 3.4% is running at a level that, if sustained, means real yields on 10-year Treasuries — nominal yield minus inflation — are actually quite thin once you account for the risk of further upside surprises. At 4.66% nominal against 3.4% headline inflation, the real yield is only 126 basis points, and that number compresses further if the Iran conflict drives another leg higher in energy prices. WTI at $87.35 and Brent at $94.20 are not yet at crisis levels, but both are elevated enough to keep upward pressure on goods and transportation costs in the August and September CPI prints that will hit before the next FOMC decision.
The 2-year yield at 4.19% is the more direct expression of near-term Fed expectations. With September hike odds at roughly one-in-three and the effective funds rate at 3.63%, the 2-year is already pricing in some probability of additional tightening over the next 12 months. If Warsh's 10 a.m. Jackson Hole speech today tilts hawkish, the 2-year moves first and moves hardest — traders should watch the 4.35%-to-4.40% range as the level the 2-year approaches if September is repriced from one-in-three to coin-flip odds. That shift would also widen the 2s-10s spread further, not tighten it, since the long end has already priced considerable risk premium and the short end would be catching up on policy expectations.
What Traders Watch Next
The immediate calendar is compressed and consequential. Today's Jackson Hole keynote at 10 a.m. ET is the first scheduled catalyst. The Federal Reserve's August event calendar shows Vice Chair Bowman speaking at 12:45 p.m. ET in a fireside chat format — less formal than Warsh's keynote but still a data point on the committee's internal alignment. Any divergence between Bowman's tone and Warsh's morning remarks would itself be a signal worth tracking, particularly given the 9-to-3 dissent at the last meeting.
Beyond today, the structural catalysts are September 11 and September 16. The September 11 CPI print is the last major inflation data point the committee will have in hand before the September 16 rate decision. A print above 3.5% on headline — entirely plausible given where energy prices have been trading — would validate the three dissenters and likely push September hike odds above 50% for the first time this cycle. That outcome would send the 10-year back toward 4.80%-to-4.90% and put the 30-year on course to retest 5.31%. TLT, which tracks long-duration Treasuries and moves inversely to yields, would face significant downside pressure in that scenario — it has already absorbed the pain of the August bond selloff, and a second leg would test the resolve of any investor treating long bonds as a safe haven in the current environment. Conversely, a CPI print at or below 3.2% on September 11 would be the first genuine data-driven argument for keeping September off the table, compressing the 2-year toward 4.00% and giving the long end some room to stabilize below 4.60%. That is the outcome the bond market needs — but the current energy price environment makes it the lower-probability path into September.
The Weekly Investor
Daily market analysis for active traders. Free.


