Treasury Curve Steepens as FOMC Week Looms
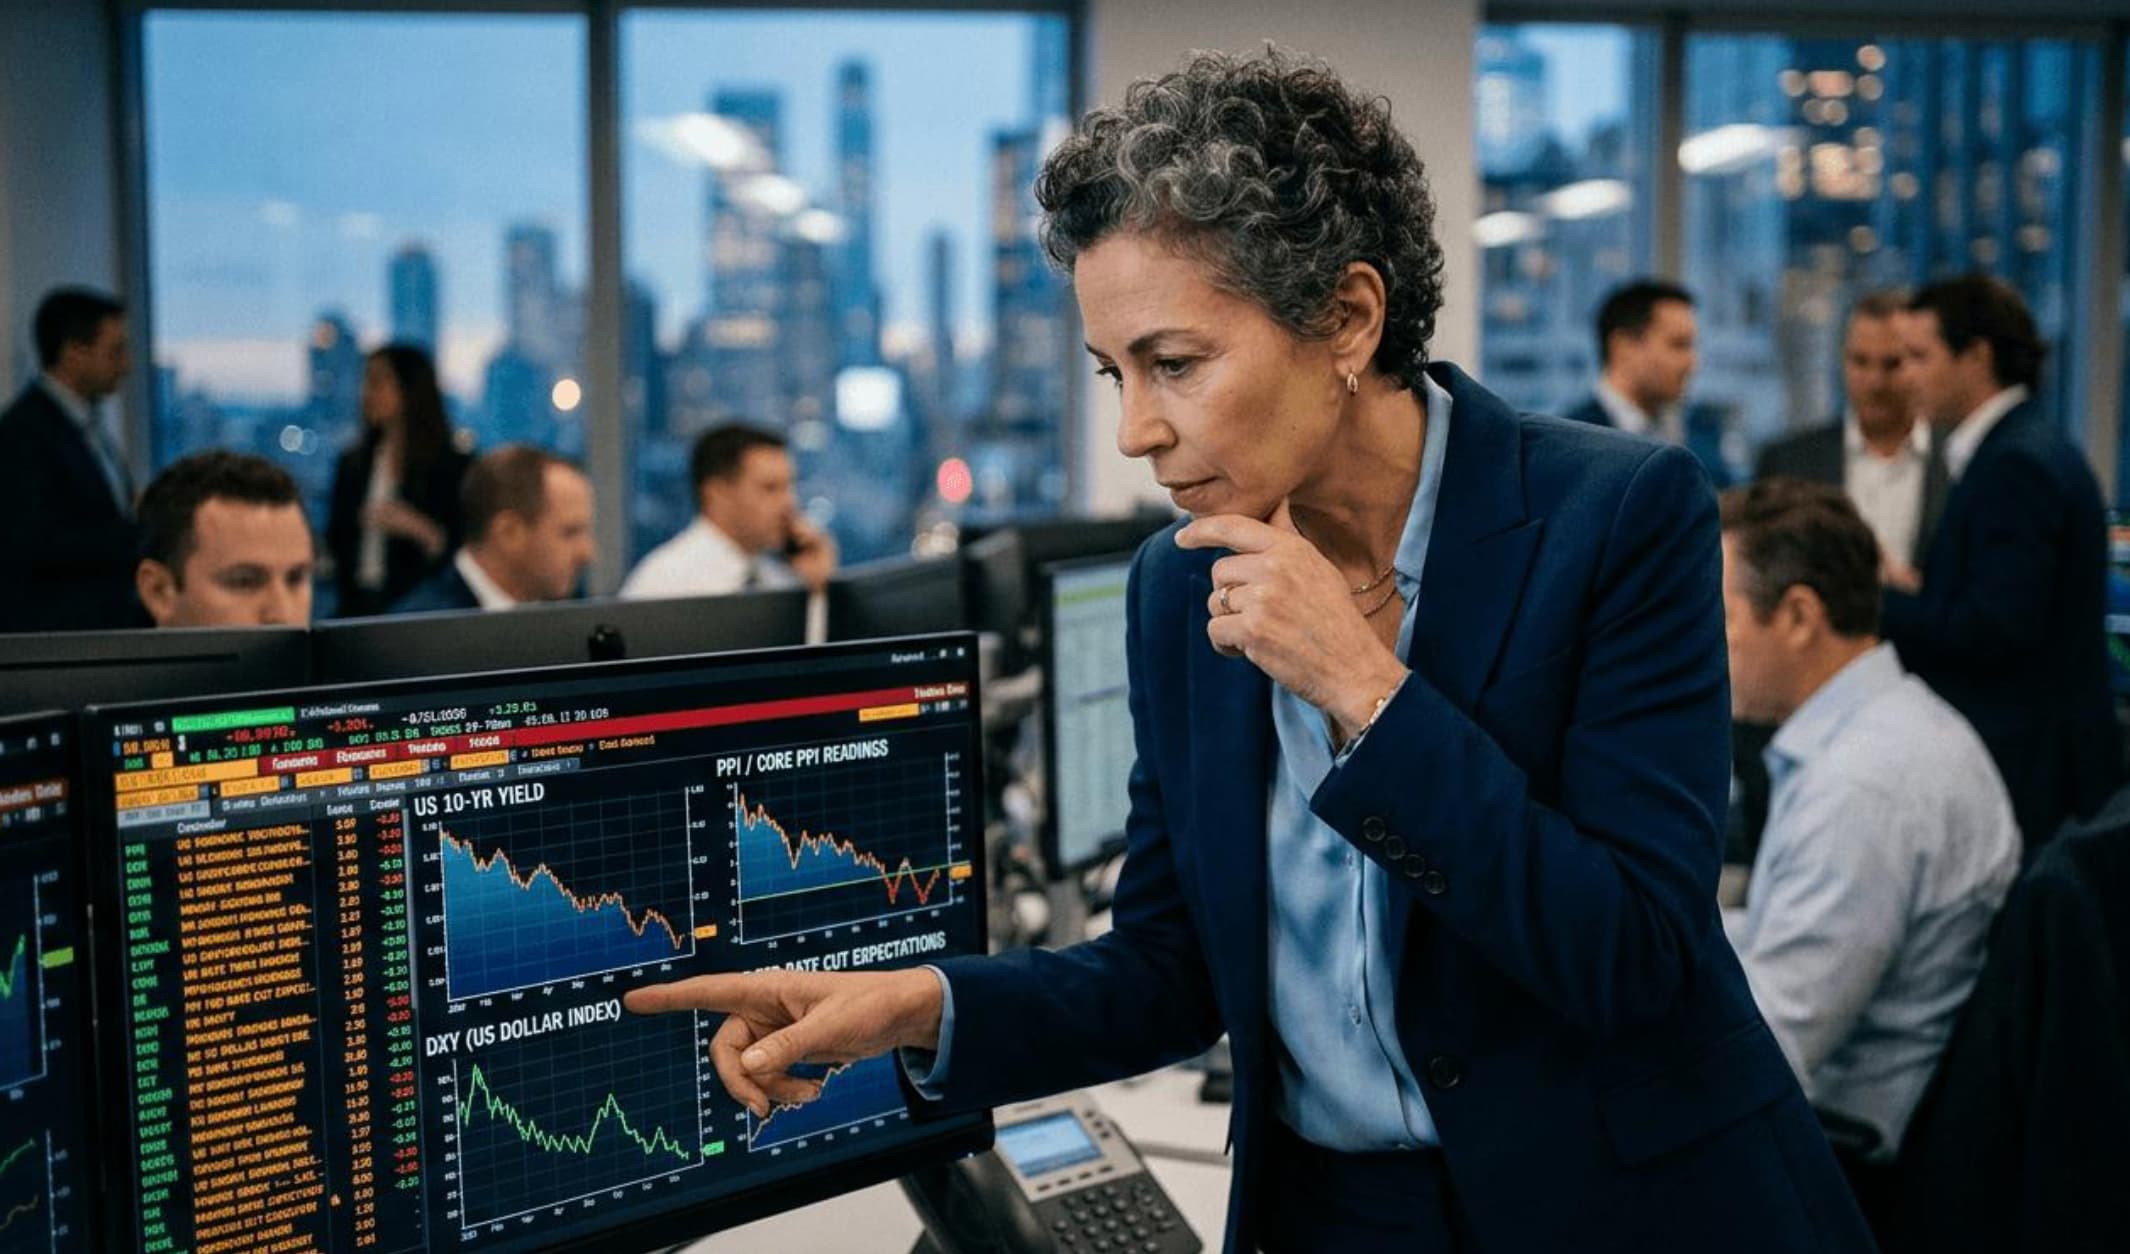
The 10-year Treasury yield sits at 4.63% vs. 4.26% on the 2-year. With FOMC July 28-29 six days out, the steepening curve signals a key rate inflection.
Key Points
- The 10-year Treasury yield closed Tuesday at 4.63% against a 2-year at 4.26%, a 37-basis-point positive spread that marks a meaningful steepening from the inverted curve that defined 2023–2024.
- The curve's positive slope reflects a market pricing in that the Fed's next move is more likely a hike than a cut, with the June SEP median pointing to one additional increase before year-end against a CPI that remains 150 basis points above the 2% target at 3.5%.
- The July 28–29 FOMC meeting is the next hard catalyst — if Chair Warsh signals the one projected hike is imminent rather than conditional, the 2-year yield will spike and the curve will flatten sharply.
The 10-year Treasury yield is sitting at 4.63% and the 2-year at 4.26%, a 37-basis-point positive spread that has quietly become one of the more important macro signals in the market right now. Six days before the July 28–29 FOMC meeting, the shape of that curve is telling traders something specific about the rate path — and it is worth reading carefully before Warsh steps to the podium next Tuesday.
What a 37-Basis-Point Spread Actually Means
A positively sloped curve is not inherently bullish or bearish — context is everything. The U.S. yield curve spent most of 2023 and 2024 deeply inverted, with the 2-year trading well above the 10-year as the Fed held the funds rate at the highest level in two decades. That inversion was the bond market's way of saying: the Fed will eventually be forced to cut, and when it does, short-term rates will fall faster than long-term rates. That trade played out. The Fed did cut, SOFR fell, and the curve normalized.
What is different now is the direction from which this positive slope arrived. The Fed cut rates in late 2024 and into 2025 as inflation appeared to be trending toward target. Then the US-Iran conflict erupted in late February 2026, energy prices surged, and the inflation data reversed. CPI for June 2026 came in at 3.5% year-over-year — down sharply from May's 4.2% print and below consensus of 3.8%, largely driven by a 5.7% monthly plunge in energy costs and a 9.7% drop in gasoline. That is encouraging. But core CPI at 2.6% annually is sticky, and the Fed's own June SEP revised its 2026 PCE inflation forecast to 3.6% — a number that is nearly double the 2% target and that the Committee explicitly tied to "supply shocks" in energy.
The funds rate target range is 3.50%–3.75%, SOFR is running at 3.61%, and the effective fed funds rate is 3.63%. With a 10-year at 4.63%, real long-term rates — adjusting for June's 3.5% CPI — are barely positive at roughly 113 basis points. That is not a restrictive long-end by historical standards, and it is consistent with a market that believes the Fed has more work to do at the short end before the cycle is truly over.
The One Projected Hike and Its Conditions
The June 17 FOMC statement was careful language. The Committee described economic activity as "expanding at a solid pace despite elevated uncertainty" — the uncertainty reference tied explicitly to the Middle East conflict — and characterized inflation as "elevated relative to the 2 percent goal, in part reflecting supply shocks in energy." That "in part" construction is doing a lot of work. It signals the Fed believes some of the current inflation overshoot is transitory, tied to the oil price spike, but is unwilling to say all of it is. The June SEP median federal funds forecast for 2026 implies one additional hike, but projections at the Fed are not commitments — they are the median dot on a scatter plot of 19 individual forecasts, each conditional on a different view of how energy prices and the broader economy evolve.
The unemployment rate at 4.2% in June is below the Fed's own revised forecast median of 4.3% for full-year 2026. Q1 GDP grew at 2.1% annualized, and the Fed penciled in 2.2% for the full year. By the Fed's own numbers, the economy is running at or slightly above their central projection while inflation sits 150 basis points above target. That is a Committee that, in the absence of a sharp deterioration in the labor market or a sustained collapse in energy prices, is biased toward doing more rather than less. The June energy price drop that pulled headline CPI down to 3.5% is the one data point that complicates that narrative — WTI crude at $80.77 and Brent at $82.93 as of July 17 remain well above pre-conflict levels, so the energy base effect that helped June's print may not repeat.
Kevin Warsh, who took the chair role this year and delivered his first congressional testimony before the House Financial Services Committee on July 14 and the Senate Banking Committee on July 15, has not yet shown the full texture of his reaction function through a live rate decision press conference. Governor Cook's July 15 remarks pointed toward careful monitoring rather than pre-commitment, but Warsh sets the tone and the market will be listening for any signal that the one projected hike is imminent — meaning at this July meeting — rather than September, November, or later.
What the Bond Market Prices Next
The 37-basis-point steepness of the curve tells a specific story: the market does not believe the one projected hike is coming this July. If it did, the 2-year would already be closer to 4.50% or above, pricing in the near-term rate increase directly. Instead, the 2-year at 4.26% suggests traders are assigning low but non-trivial probability to a July hike while placing the higher-probability outcome somewhere later in 2026 — likely September or November. That is roughly consistent with the ECB's own September hike timeline, and creates an environment where both major central banks could be moving in the same direction at roughly the same time, a coordinated tightening impulse that would pressure risk assets globally.
The natural gas market adds another variable. Henry Hub at $2.79 per MMBtu is historically low and not a source of domestic inflationary pressure. But WTI crude and Brent crude above $80 remain the linchpin — any re-escalation in the Middle East that pushes oil back toward $90 would likely reverse June's favorable energy CPI print, reignite headline inflation, and materially increase the probability that the Fed moves in September or earlier. Conversely, a sustained oil price decline toward $75 would give Warsh political and analytical cover to hold indefinitely.
The specific levels traders need on their screens going into next Tuesday: 2-year Treasury at 4.26% is the pivot. A Warsh press conference on July 29 that signals the one projected hike is imminent — rather than conditional on future data — would push the 2-year above 4.40% rapidly and flatten the curve back toward or potentially through zero spread. That flattening trade, long the 10-year versus short the 2-year, is the positioning expression of a hawkish surprise. The opposite — Warsh emphasizing patience, citing the favorable June CPI print, and signaling no urgency — steepens the curve further and supports equities and credit. July 29, 2:00 p.m., is the moment of maximum informational content for every rate-sensitive position in the book.
The Weekly Investor
Daily market analysis for active traders. Free.