
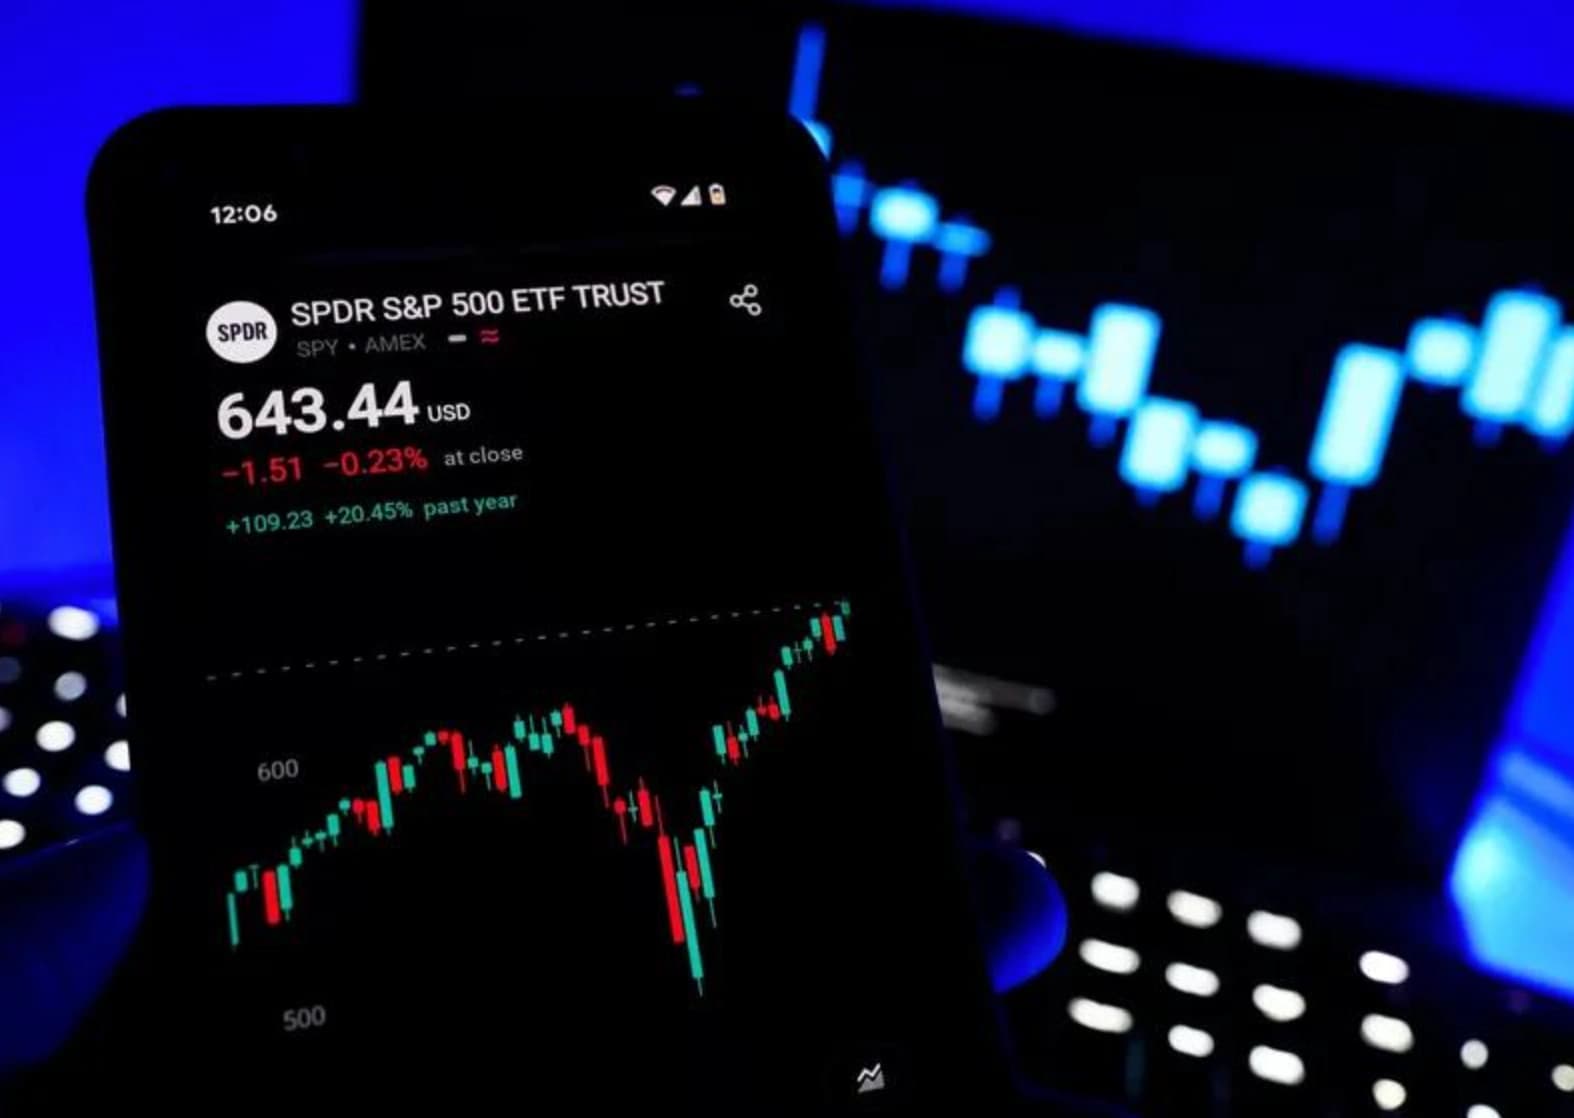
SPY Pulls $4.81B in One Day as QQQ Bleeds to QQQM
S&P 500 ETFs absorbed $6.38 billion in a single session Friday. Here's where the smart money actually went — and what it signals for Tuesday.
Key Points
- SPY absorbed $4.81 billion in a single session Friday, Aug. 24 — the largest single-day inflow of any ETF — lifting its AUM by 0.58%.
- QQQ shed $250.58 million while the identical-index QQQM gained $383.21 million, a wrapper arbitrage driven by a 1.03 percentage point expense ratio gap.
- Watch whether SPY's inflow momentum holds through the Aug. 27 close — a reversal there would be the first clean risk-off signal in a week.
$6.38 billion flooded into S&P 500 ETFs in a single session on Friday, Aug. 24 — SPY alone absorbing $4.81 billion of it. But the sharper trade for active investors isn't in that headline number. It's in the simultaneous QQQ exodus and QQQM surge, a value-factor reshuffle, and a gold position that confirms this isn't a pure equity conviction play.
The Rotation Hidden Inside the Inflow Data
SPY's $4.81 billion single-session haul lifted its total AUM by 0.58% in one trading day, a move that would be unremarkable in a bull-market blowoff but carries specific weight now. The 10-Year Treasury yield is sitting at 4.74% as of Aug. 21 — a level that has historically pressured equity multiples and pushed investors toward shorter-duration assets. The fact that long-only equity ETFs are still absorbing this volume tells you that institutional desks aren't hedging for recession; they're hedging for volatility within a continued expansion. VOO's additional $1.58 billion confirms it: this is a broad-market accumulation trade, not a tactical momentum play concentrated in a single name or sector.
The AVLV-versus-VTV divergence is the subtler signal worth unpacking. Avantis U.S. Large Cap Value ETF pulled in $1.07 billion on Friday while Vanguard Value ETF shed $776.47 million simultaneously. Both track large-cap value. The difference is methodology and cost: AVLV uses a profitability screen layered on top of valuation metrics, while VTV is a plain-vanilla price-to-book sort. When money moves from VTV to AVLV at this scale in a single session, it isn't a bet against value — it's a bet on *quality* value, specifically companies with high earnings relative to book that can sustain margins in a 4.74% rate environment. That's a meaningful refinement of the factor trade, not a reversal of it.
The QQQ Paradox Explained
QQQ posted $250.58 million in net outflows Friday while QQQM — which tracks the exact same Nasdaq-100 index — attracted $383.21 million. Together that's a net positive for Nasdaq-100 exposure of roughly $132 million, but the wrapper migration deserves its own analysis. QQQ carries a 0.99% expense ratio. QQQM charges 0.15%. On a $100 million position held for one year, that 0.84 percentage point gap costs an institutional desk $840,000 in unnecessary friction. As allocations to Nasdaq-100 have grown, the cost of staying in the legacy wrapper has become impossible to justify internally.
This isn't new — the QQQ-to-QQQM rotation has been a slow bleed for two years — but Friday's single-session data shows the pace accelerating. The implication for active traders: the negative QQQ flow number is not a signal to short tech. It is a mechanical artifact of cost-driven reallocation. Today's session confirms the thesis — QQQ is up 1.0% Tuesday, Aug. 25, outperforming SPY's 0.5% gain and DIA's 0.46% rise. Tech is not being abandoned. It is being repriced into a cheaper wrapper at scale. Traders who interpret QQQ outflows as sector-level pessimism are misreading the signal entirely.
The broader Nasdaq momentum is supported by cooling core inflation. Core CPI sits at 2.5% year-over-year as of July, and while headline CPI at 3.3% remains above the Fed's 2% target, the downward trend in core gives technology stocks a longer-duration multiple expansion argument. Growth equities are priced on future earnings; lower expected inflation reduces the discount rate applied to those future cash flows. That's the fundamental underpinning of today's +1.0% QQQ session, and it's consistent with the wrapper migration: investors aren't buying Nasdaq-100 exposure reluctantly — they're building it more efficiently.
The Barbell Bet: Gold and Bonds Alongside Equities
The piece of Friday's flow data that most demands a trader's attention is GLD's $613.72 million single-session inflow, running in parallel with $4.81 billion into SPY. These are not typically correlated trades. Equity accumulation at this velocity usually signals risk appetite that pushes gold lower, as the opportunity cost of holding a non-yielding asset rises. The fact that both are being bought simultaneously — and that VCIT (Vanguard Intermediate-Term Corporate Bond ETF) added $765.44 million the same day — indicates that institutional portfolios are running a barbell: full equity exposure on one end, hard-asset and credit hedges on the other.
The energy sector is the clear casualty of this positioning. USO dropped 2.91% Tuesday as WTI crude remains at $84.05 per barrel and Brent sits at $92.51 — levels that reflect supply-demand equilibrium rather than geopolitical risk premium. XLE fell 0.97% in today's session, making energy the sharpest underperformer in the market on a day when SPY is up half a percent. If gold is absorbing the geopolitical risk premium that energy typically carries, that is a structural shift in how portfolios are hedged — one that could persist through the fall if Middle East tensions remain elevated without a direct supply disruption.
The fixed-income context reinforces the defensive overlay: the week ending Aug. 14 saw bond ETFs absorb $13.2 billion out of a total $41.0 billion in ETF inflows. TLT alone took in $1.414 billion that week, representing 3.32% of its total AUM — a significant single-week move for a fund that size. With the 2-Year yield at 4.24% and the 10-Year at 4.74%, the yield curve is 50 basis points positive — steeper than it was six months ago — and duration buyers in TLT are making a bet that the long end is near its ceiling. The SOFR rate at 3.65% and Fed Funds at 3.63% suggest the Fed is on hold, which gives bond ETF buyers a cleaner entry than they've had in 18 months.
What Traders Watch Next
The YTD ETF inflow figure approaching $1.3 trillion by July is the macro anchor. That pace, if sustained, would easily surpass any full-year record. But the composition of those flows matters more than the volume. The current mix — broad equity accumulation, quality-factor rotation, gold hedging, and duration buying — is consistent with a late-cycle expansion playbook, not a momentum-driven melt-up. The critical level to monitor is whether SPY holds above its Friday closing print through the Aug. 27 session. A failure to hold — particularly if accompanied by a reversal in GLD or a spike in VCIT spreads — would be the first clean risk-off signal in a week of otherwise constructive flows. The bitcoin ETF streak, now at seven consecutive days of net inflows totaling more than $2.5 billion, is a secondary confirming indicator: that streak breaking would be the market's canary. Watch the Aug. 27 close across SPY, GLD, and spot bitcoin simultaneously — if all three are net positive on the week, the barbell trade has legs into September.
The Weekly Investor
Daily market analysis for active traders. Free.


