
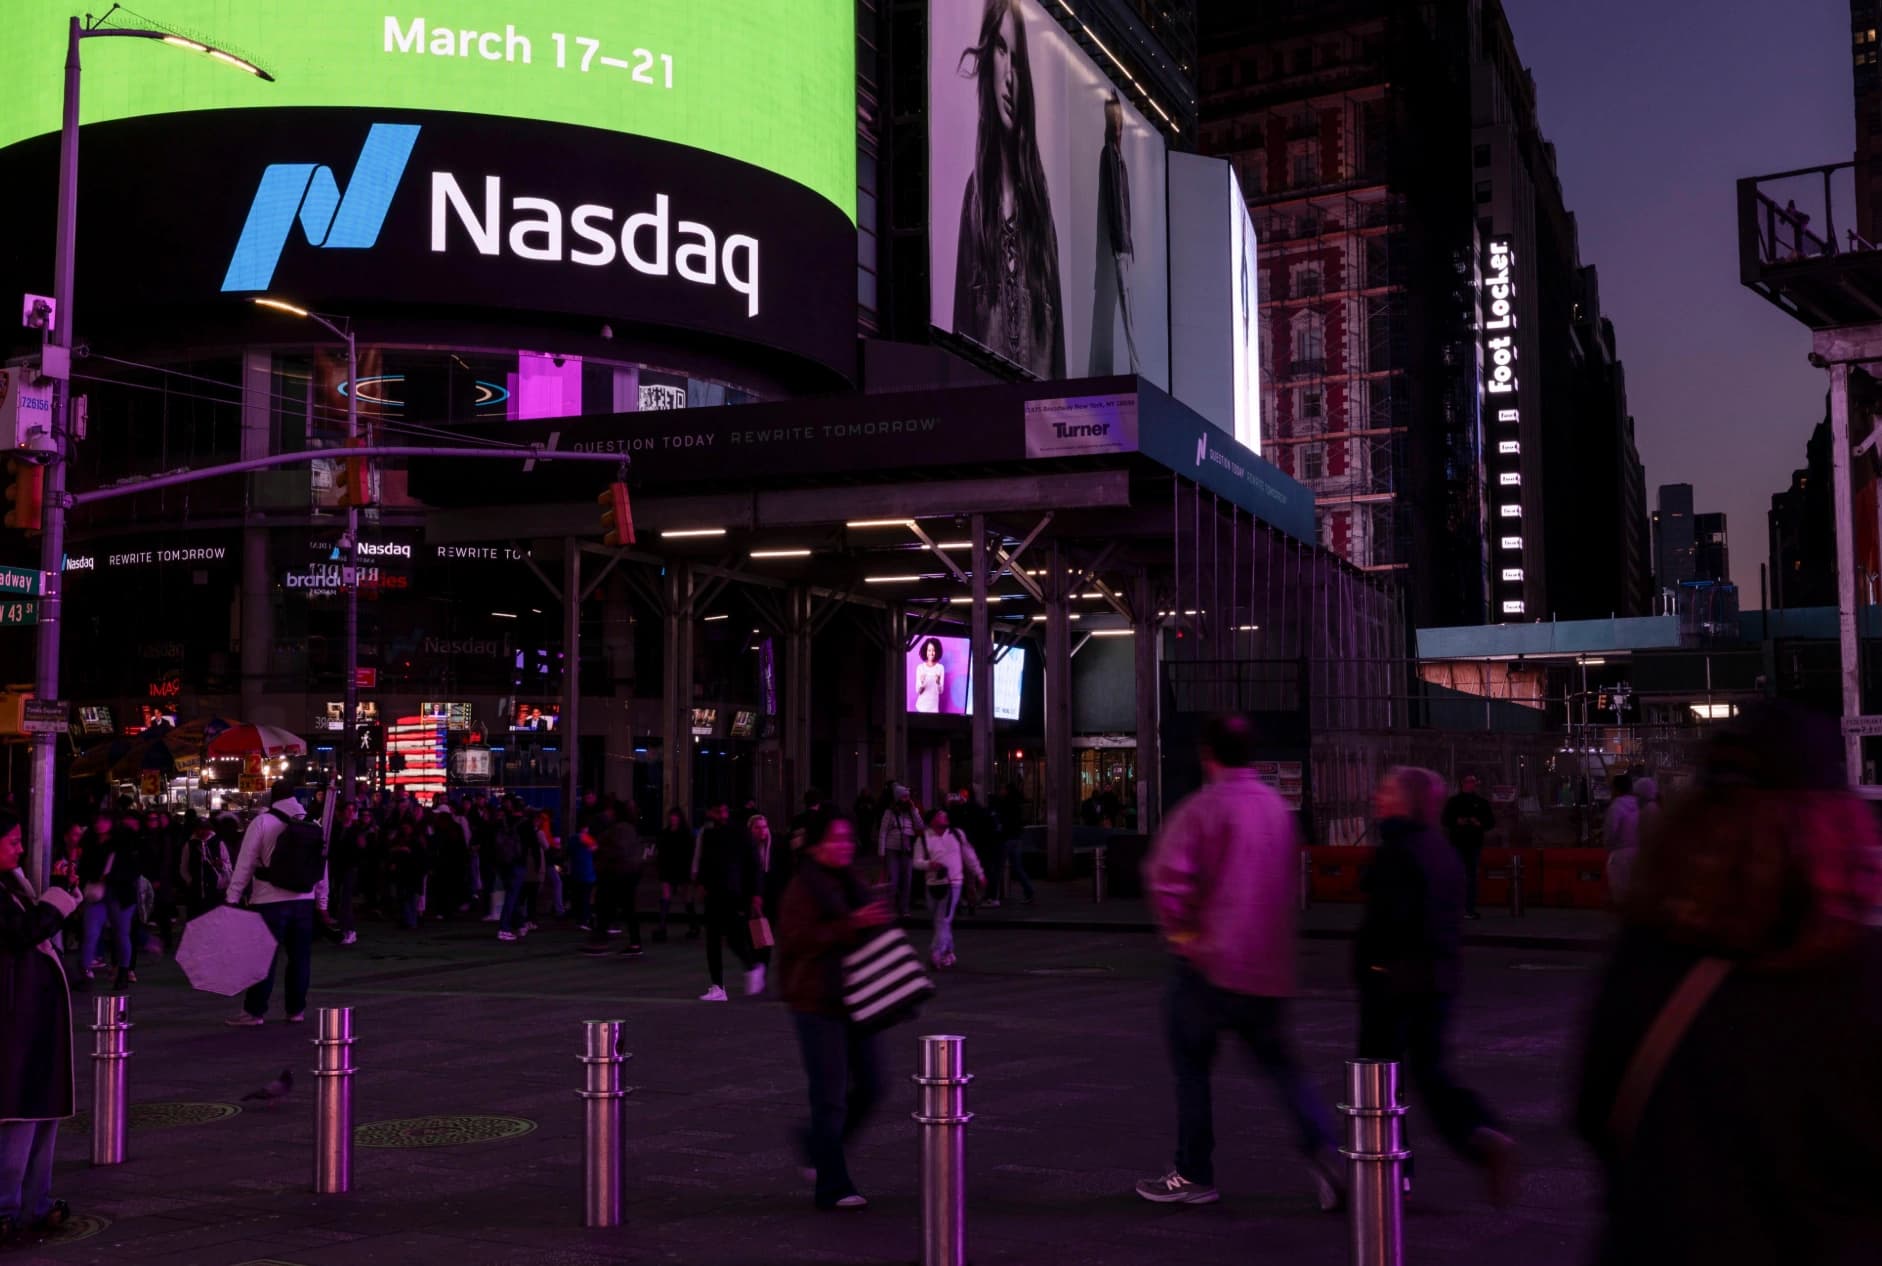
QQQ Bleeds $250M While QQQM Gains: The Wrapper Shift
QQQ shed $250 million in a single day as QQQM absorbed $383 million. The same index, two wrappers — and institutional money knows which one it wants.
Key Points
- QQQ recorded $250.58 million in net redemptions on August 22 while QQQM — its lower-cost twin tracking the identical Nasdaq-100 index — pulled in $383.21 million on the same day.
- Institutional investors are migrating from QQQ's higher expense ratio to QQQM's cheaper wrapper, a structural shift that accelerates as large allocators optimize for basis points at scale.
- Watch whether QQQ's outflow trend persists through Friday's close; sustained weekly redemptions would confirm the wrapper migration is now a durable structural rotation, not a one-day blip.
On August 22, QQQ — the world's most actively traded tech ETF — shed $250.58 million in a single session while QQQM, Invesco's functionally identical Nasdaq-100 vehicle, simultaneously absorbed $383.21 million. Same index. Same holdings. Same provider. The only meaningful difference is cost — and institutional money has made its decision.
The Wrapper Arbitrage Nobody Talks About
QQQ carries an expense ratio of 0.20%. QQQM charges 0.15%. Five basis points sounds trivial until you're allocating $500 million, at which point the annual cost difference is $250,000 — real money for a pension desk or a large RIA optimizing for net-of-fee performance. That math has been apparent since Invesco launched QQQM in October 2020 as an explicit institutional alternative to QQQ's retail-era pricing, but the migration is now accelerating in a way the daily flow data makes impossible to ignore.
The August 22 session crystallized the dynamic in a single data point. QQQ, which still commands massive AUM and remains the dominant vehicle for short-term tactical trading and options activity, is being used differently than QQQM. Fast money — hedge funds, market makers, derivatives desks — stays in QQQ precisely because of its liquidity and the depth of its options chain. That cohort is not leaving. What is leaving is the longer-duration, buy-and-hold institutional capital that has no use for QQQ's options ecosystem and every incentive to minimize drag. When that capital exits QQQ and enters QQQM on the same day the same underlying index is seeing net positive institutional interest, the split flow tells a cleaner story than any survey or 13-F filing.
SPY's $4.81 Billion Day Changes the Context
The QQQ-to-QQQM migration does not exist in a vacuum. On the same August 22 session, SPY pulled in $4.81 billion in a single day — lifting its AUM by 0.58% — while VOO added $1.58 billion. That $6.38 billion combined inflow into broad S&P 500 exposure is not consistent with a risk-off environment. Investors are not fleeing equities. They are rotating within equities, specifically away from Nasdaq-100 concentration risk and toward broader market exposure that dilutes the outsized weight of the five largest tech names.
Within XLK — the SPDR sector ETF most directly aligned with QQQ's underlying holdings — Nvidia carries a 14.66% weight, Apple sits at 12.85%, and Micron has returned over 290% in a run that has stretched valuations across the memory complex. Broadcom, at a 5.48% weight, added 7.08% in the first half of 2026. These are not companies that retail investors are running away from. But at current concentration levels, the Nasdaq-100's top five names represent a binary bet on continued AI infrastructure spending and sustained margin expansion — a bet that large institutional allocators are increasingly unwilling to make at full weight. The SPY and VOO inflows on August 22 represent, in part, that deconcentration trade expressed in ETF form.
Gold confirmed the risk-hedge overlay. GLD pulled in $613.72 million on August 22, reinforcing that at least a portion of the capital coming out of QQQ and into broader market vehicles is being paired with a tail-risk hedge rather than a straightforward growth rotation.
What the Duration and Crypto Flows Add to the Picture
The QQQ-QQQM split sits inside a broader reconfiguration of ETF capital that has been building since July. ETF inflows hit $191 billion in July alone, pushing 2026's running total to approximately $1.3 trillion. That headline number masks significant internal rotation. Ultrashort bond ETFs have absorbed $72.1 billion year-to-date as investors parked cash at elevated short-term rates — the SOFR rate sits at 3.66% as of August 25, making ultrashort credit a legitimate alternative to equity risk for capital that needs to stay liquid. Intermediate-duration strategies have drawn roughly $80 billion across core and core-plus mandates. But the most significant shift at the margin is in long-duration: TLT and its peers just posted their best single month, recording over $4 billion in inflows after taking in roughly $2 billion across the entire first half of 2026.
That duration rotation is a direct read on where sophisticated fixed income investors think the Fed's rate path is heading. With the 10-year Treasury yield at 4.64% and the 2-year at 4.17% as of August 25, the curve has steepened into positive territory — a configuration that historically rewards duration extension. Buyers accumulating TLT at current levels are positioning for the view that 4.64% on the 10-year is a ceiling, not a floor. If they are right and yields compress, the capital gains on long-duration bonds will be substantial. The fact that this rotation is happening through ETFs — not mutual funds, which saw $16.82 billion in estimated net outflows in the week ended August 12 — confirms the structural wrapper shift extends well beyond the Nasdaq-100 ecosystem.
Spot bitcoin ETFs added $606 million on August 20 while ether ETFs contributed $221 million, marking a second consecutive day of accelerating multi-asset crypto inflows. XRP funds added $13 million and Solana $15 million on the same session. These are not speculative retail flows. The consistency of the institutional bid behind bitcoin's rally — confirmed by the daily inflow trajectory rather than a single spike — fits the same framework driving the QQQM migration: institutional capital is optimizing its wrapper, its cost basis, and its risk exposure simultaneously, and the ETF ecosystem is the primary vehicle for executing all three decisions at scale.
What Traders Watch Next
The immediate test is whether QQQ's August 22 outflow was a one-session anomaly or the opening print of a sustained weekly trend. If QQQ posts net redemptions again in Friday's flow data — expected to publish late Friday or early Monday — the wrapper migration thesis gains significant confirmation. A second consecutive weekly outflow from QQQ paired with continued QQQM inflows would represent a structural signal, not noise. Watch the $383 million QQQM inflow level specifically: if QQQM sustains weekly inflows above $300 million through September while QQQ continues to bleed, the cost-driven migration has crossed from an emerging trend into a durable reallocation. Beyond the wrapper story, the September Fed meeting is the macro pin. With the Fed Funds rate at 3.63% and core CPI at 2.5% year-over-year as of July, the policy path has room to ease — and any dovish signal at September's meeting would likely accelerate the long-duration bond ETF inflows already building in TLT, while simultaneously providing the macro cover for a QQQ recovery that would complicate the deconcentration narrative. Traders positioned in QQQM should treat the September Fed decision as a key inflection point for both the wrapper migration and the Nasdaq-100 growth premium.
The Weekly Investor
Daily market analysis for active traders. Free.


