June Jobs Report: 115K Consensus, ADP Already Missed
BLS June nonfarm payrolls drop at 8:30 AM ET today. ADP missed at 98K vs. 110K forecast. Here's what the number means for Fed rate policy.
Key Points
- ADP private payrolls came in at 98,000 for June — 12,000 below consensus and the weakest read since February — setting a cautious tone ahead of this morning's official BLS print at 8:30 AM ET.
- A sub-100K official print reopens the rate-cut narrative; anything above 140K hands Chair Warsh the ammunition he needs to hold longer or move toward a hike, with the median Fed projection already penciling in only two more cuts for all of 2026.
- Watch the unemployment rate tick — if it falls to 4.2% even on modest payroll growth, that alone is a hawkish signal that could push the 2-year Treasury yield back above 4.25%.
Wall Street is bracing for 115,000 nonfarm payrolls when the BLS Employment Situation report hits at 8:30 AM ET this morning — but ADP already telegraphed softness Wednesday, printing 98,000 private-sector jobs against a 110,000 forecast and well below May's 122,000 revised figure. Today is the number that moves markets. With July 3 a federal holiday, this print lands with no buffer: whatever reaction the data triggers, traders carry it into a long weekend with thin liquidity and no Fed speaker scheduled to walk anything back.
What the Data Actually Shows
The ADP report is an imperfect leading indicator — it has consistently undershot the official BLS print throughout 2026 — but the internals this time are hard to dismiss. Of the 98,000 ADP jobs added in June, 48,000 came from education and health services alone, a sector notorious for seasonal adjustment noise in summer months. Strip that out and the underlying private labor market generated roughly 50,000 jobs, a number that would constitute a material deceleration if the BLS report rhymes with it. Leisure and hospitality, often a litmus test for consumer demand, contributed just 2,000 positions. Natural resources and mining shed 5,000 — the only sector in the red — consistent with WTI crude sitting at $73.59 a barrel and producer margins under pressure.
The BLS benchmark from May shows the challenge of extrapolating from ADP. May nonfarm payrolls came in at 172,000, roughly 40% stronger than what ADP's methodology would have implied, and April was revised to 179,000. Average hourly earnings in May rose 0.3% month-over-month and 3.4% year-over-year to $37.53, largely in line with what the Fed wants to see on wage disinflation. The wrinkle: healthcare worker wages have been dragging down the aggregate index for months, masking underlying wage pressure in other sectors. Strip healthcare out and the wage picture is less comfortable. Analysts who have done that decomposition say core private-sector wages outside healthcare are running closer to 4.0% annually — still above the Fed's implicit ceiling.
Wall Street's range for today's print spans 87,000 on the low end to roughly 130,000 at the top of the bull case, with the consensus cluster sitting at 115,000. The unemployment rate is broadly expected to hold at 4.3%, though a subset of strategists argue that continued strength in the household survey — which feeds the unemployment calculation separately from the establishment survey payroll count — could push the rate down to 4.2%. That matters more than it sounds. Several Fed officials have noted in research and commentary that the breakeven level of monthly job growth needed to keep unemployment stable may have drifted close to zero, given demographic shifts in labor force participation. In that world, even a "soft" 90,000 payroll print could be consistent with a tightening labor market — the opposite of what rate-cut bulls need to see.
The Fed's Problem
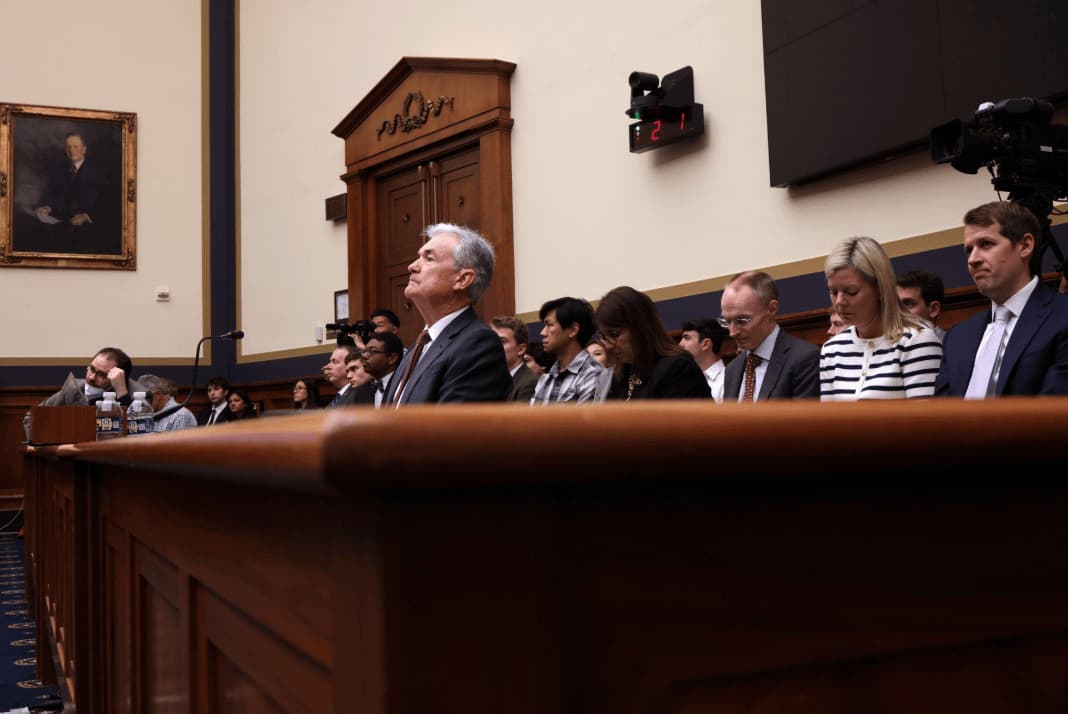
Fed Chair Kevin Warsh spoke at the ECB Forum in Sintra, Portugal on June 30, and his message carried no ambiguity: "We're all in the price stability business...we've all looked around, and we've seen that prices are too high." He declined to offer any signal on the July rate decision, which is precisely the kind of non-answer that leaves the 2-year Treasury yield — currently at 4.14% — vulnerable to a sharp move on either side of this morning's data.
The FOMC held at 3.50%–3.75% on June 17, its third consecutive hold. The statement flagged elevated inflation "in part reflecting supply shocks in energy" and pointed to Middle East conflict as a source of ongoing uncertainty — diplomatic language that describes a situation in which the Fed is caught between softening growth and inflation running at 4.2% year-over-year on headline CPI as of May, double its stated target. Core CPI at 2.8% is more manageable but still above 2%, and the trajectory since March — when twelve-month CPI was 3.3% — is the wrong direction. Average headline CPI ran at 0.4% per month in Q1 2026, up from 0.2% in Q4 2025. That acceleration, if it continued through Q2, is exactly what Warsh was signaling at Sintra.
The dot plot last updated in March pointed to two additional rate cuts in 2026. That projection is almost certainly stale. A survey of 34 former Fed officials and staff conducted June 5–12 found 17 of 32 respondents believed a rate hike would likely be appropriate this year — a number that would have been unthinkable six months ago. SOFR sits at 3.68% and the effective fed funds rate at 3.63%, reflecting where markets are pricing overnight rates after the most recent cut cycle. The 30-basis-point spread between the 10-year Treasury at 4.44% and the 2-year at 4.14% is a modestly positive slope — not the deep inversion of 2023, but not the sharply upward curve of an economy priced for aggressive easing either. It is the yield curve of a market that genuinely doesn't know what the Fed does next.
What Traders Watch Next
The market reaction playbook for this morning is relatively clean on the extremes. A print below 100,000 with unemployment rising to 4.4% forces rate-cut pricing back into the September FOMC meeting and puts a bid under long-duration Treasuries; TLT could see a 1.5–2 point move. A print above 140,000 — particularly if paired with wages accelerating above 0.4% month-over-month — does the opposite, pushing the 2-year yield toward 4.30% and increasing the probability that the next Fed move is a hike rather than a cut. The harder scenario to trade is a print in the 100–125,000 range, which keeps all debates open and likely produces a modest rally on relief before conviction fades into the long weekend.
Beyond today, the next scheduled data catalyst is the June CPI report on July 14 at 8:30 AM ET. That number, not today's, will ultimately determine whether the FOMC changes its assessment at the July 29–30 meeting. If CPI continues tracking at or above 4.0% year-over-year — the Chained CPI-U was at 4.0% for the most recent month — Warsh's tone at Sintra is not rhetorical: it is a warning. Traders who have been positioned for rate cuts in the back half of 2026 need a jobs number soft enough to revive that story this morning, or they spend the next two weeks waiting on July 14 to find out whether the Fed's next move is the one nobody priced.
The Weekly Investor
Daily market analysis for active traders. Free.