June CPI Drops: What the Number Actually Means
June CPI headline falls on energy reversal, but core inflation holds near 2.9%. Here's what the print means for the July 29 FOMC decision.
Key Points
- Headline CPI for June is expected to print near -0.1% month-on-month and 3.9% year-over-year, down from May's 4.2% — entirely on a gasoline price reversal that has already begun unwinding.
- The ceasefire that drove June gasoline prices down 10% collapsed on July 8, and fresh U.S. airstrikes plus Iran's Strait of Hormuz closure claim have already pushed crude back toward the levels that drove May's 4.2% print.
- With the FOMC split 9-to-8 on whether to hike before year-end, watch the 2-year Treasury yield — currently 4.21% — for the real-time market verdict on where July 29 is headed.
June CPI landed at 8:30 AM ET this morning, and the headline number will almost certainly look better than May's 4.2% year-over-year print — possibly as low as 3.9%. Don't be fooled. The drop is a gasoline story, not a disinflation story, and the fuel driving it reversed course six days ago.
What the Data Actually Shows
The Bureau of Labor Statistics reported May CPI at +0.5% month-on-month seasonally adjusted, with energy accounting for more than 60% of that monthly gain. The energy index rose 3.9% in May alone, the third consecutive month of energy-driven acceleration following a 10.9% surge in March tied directly to the Iran energy shock. That sequence — March's spike, April's follow-through, May's confirmation — is what pushed the 12-month headline rate to its highest level since April 2023.
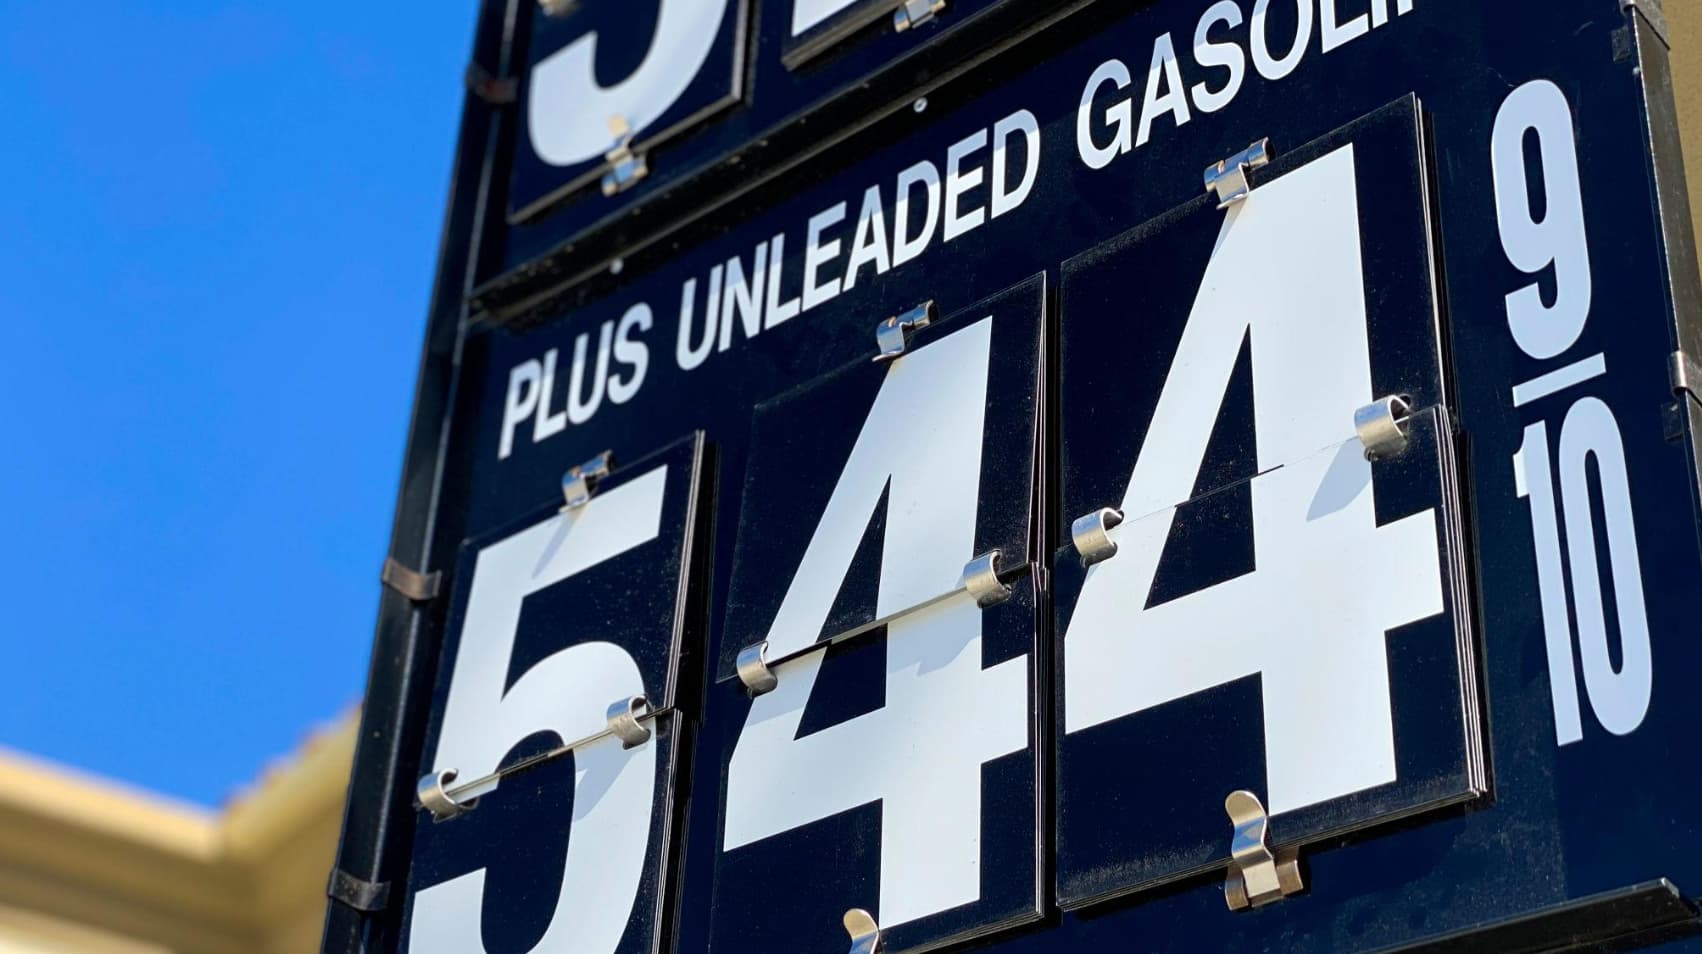
June's reversal is real but narrow. Gasoline prices fell roughly 10% during the month, according to BMO Capital Markets, and that decline single-handedly explains the expected swing from +0.5% to approximately -0.1% on the monthly headline. The Cleveland Fed's Nowcasting model corroborated this, projecting headline CPI down about 0.1% month-on-month and up approximately 3.9% year-over-year. Core CPI — which strips out food and energy entirely — was projected to print +0.2% month-on-month and +2.85% year-over-year, barely changed from May's +0.2% monthly and +2.9% annual reading. That core stickiness is the number that matters for the Federal Reserve, and it is not moving in the right direction at the speed the committee needs.
Shelter continues to carry the underlying pressure. In May, the shelter index rose 0.3% on the month and remains one of the largest single contributors to the core reading. Food away from home added another 0.3% in May. These categories don't move with oil prices, and they won't give back ground just because a temporary ceasefire briefly cooled the gasoline pump. The Fed has been watching core services ex-shelter — sometimes called "supercore" — for precisely this reason, and nothing in the June setup suggests that measure is breaking lower in a sustained way.
The Energy Reversal That Already Reversed
The ceasefire that cut gasoline prices in June ended on July 8. Within 48 hours, the United States conducted fresh airstrikes, and Iran renewed its disputed claim to close the Strait of Hormuz. WTI crude as of July 3 — the most recent data in our feed — sat at $70.48 per barrel and Brent at $69.70. Those levels already reflect some re-escalation premium, and the trajectory since July 8 points higher. The Iran energy shock that drove March's 10.9% energy index surge did not disappear; it paused for roughly six weeks and is now reasserting itself.
This is the core analytical trap in today's print. A falling annual headline rate — from 4.2% to a projected 3.9% — will generate headlines about inflation cooling. Portfolio managers who bought that narrative in early June, when the ceasefire first took hold, are now sitting on oil exposure that has re-priced against them. The July CPI report, which won't drop until mid-August, will likely capture a renewed energy surge. If WTI moves back toward the $75-to-$80 range — which several desks were pricing as the base case before the ceasefire — the 12-month headline rate could re-accelerate toward 4.5% by the August print. That would arrive three weeks after the July 29 FOMC decision, which makes today's data disproportionately powerful in shaping near-term policy expectations.
What Traders Watch Next
The 2-year Treasury yield is the cleanest real-time policy barometer available, and it closed last Thursday at 4.21% — 59 basis points above the current effective Fed funds rate of 3.62%. That spread encodes a market that is pricing in meaningful probability of at least one more hike but hasn't fully committed. A core CPI print that comes in at or above 2.9% year-over-year this morning will pressure that 2-year yield higher; a soft surprise below 2.8% could briefly steepen the curve as rate-hike probability gets dialed back.
The 10-year yield at 4.56% gives the spread between 2s and 10s at 35 basis points — a curve that has re-steepened modestly from inversion but remains historically flat, reflecting the market's uncertainty about whether the Fed tightens into a slowing economy or holds while inflation stays sticky. The Federal Reserve's June Summary of Economic Projections put 2026 PCE inflation at 3.6% and core PCE at 3.3% — both well above the 2% target — while projecting real GDP growth of 2.2% and unemployment at 4.3%. The current unemployment rate of 4.2% is already nearly at the Fed's full-year projection with six months left in the year, which limits how much labor market deterioration the committee can invoke as cover for staying on hold.
The FOMC is functionally split — nine of 18 participants who submitted June projections expected at least one rate hike before year-end, eight projected no change. Fed Chair Kevin Warsh testifies before the House Financial Services Committee at 10:00 AM ET today, 90 minutes after this CPI print, and his language on inflation persistence versus transitory energy effects will either validate or undercut whatever the 8:30 number showed. The BLS CPI release page carries the full data tables for traders who want to dig into the component breakdown rather than rely on the headline. Watch specifically the owners' equivalent rent line inside shelter and the services ex-energy services reading — if either accelerates on the month, the case for a July 29 hike gets materially stronger regardless of what the headline shows. The July 29 decision date is the level that anchors everything this morning.
The Weekly Investor
Daily market analysis for active traders. Free.