GDP Slumps to 1.5% as Global Rate Divergence Widens
Final Q2 2026 GDP prints at 1.5% annualized as the Fed hikes and ECB tightens 40bps — the widest global policy divergence in years hits traders today.
Key Points
- Final Q2 2026 GDP printed at 1.5% annualized — 60 basis points below the prior estimate of 2.1% — while the Fed simultaneously operates at its highest policy rate since 2026 began.
- Global monetary policy divergence is at a multi-year extreme: the ECB just hiked 40bps to 2.65%, the SNB cut to 0.0% to fight deflation, and Brazil's Selic sits at 14.0% after easing — all in the same quarter.
- The 2027 U.S. GDP forecast of -2.1% means traders should be building exposure frameworks now for a potential recession environment while the Fed is still tightening.
Final Q2 2026 GDP came in at 1.5% annualized — down from the prior estimate of 2.1% and the weakest quarterly growth print in over a year — arriving on the same morning the Fed's preferred inflation gauge shows zero progress toward the 2% target. End of quarter, end of the soft-landing narrative's last credible data point.
The Growth Cliff Taking Shape
A 1.5% annualized growth rate in Q2 would be manageable in isolation. It is not in isolation. The full-year 2026 U.S. GDP forecast sits at +2.3%, which means the back half of the year needs to carry the weight of a front half that is clearly decelerating. More critically, the 2027 forecast stands at -2.1% — a swing of more than 4 percentage points in 12 months that, if accurate, would represent one of the sharpest single-year growth reversals in the post-financial-crisis era outside of the pandemic contraction.
That 2027 number is not yet consensus, but it is directionally consistent with what the current data mosaic implies. The Fed just raised rates to 3.75%–4.00% on September 15 — the first hike since 2023 per the Federal Reserve's own release — and 16 of 18 participants signaled at least one more increase ahead. Historically, rate hike cycles operate on a 12–18 month lag before their full impact on growth registers. That lag mathematics points squarely at 2027. The Fed is hiking now; the economy will feel the full force of those hikes in the year when, by current projections, it can least afford them.
The sectoral breakdown of the labor market adds texture to the growth picture. Manufacturing lost 17,000 jobs in August, professional services shed 16,000, and information dropped 4,000 — the three categories most associated with capital investment, productivity growth, and business confidence. The sectors adding jobs — education, health care, leisure, hospitality, construction — are either government-adjacent or highly interest-rate-sensitive in their own right. Construction hiring positive in a rising-rate environment is a signal worth watching closely; that sector typically rolls over 2–3 quarters after mortgage rates peak. If construction employment reverses while services payrolls stall, the headline unemployment rate of 4.1% has a clear path to 5% or higher through 2027.
The Widest Policy Divergence in Years
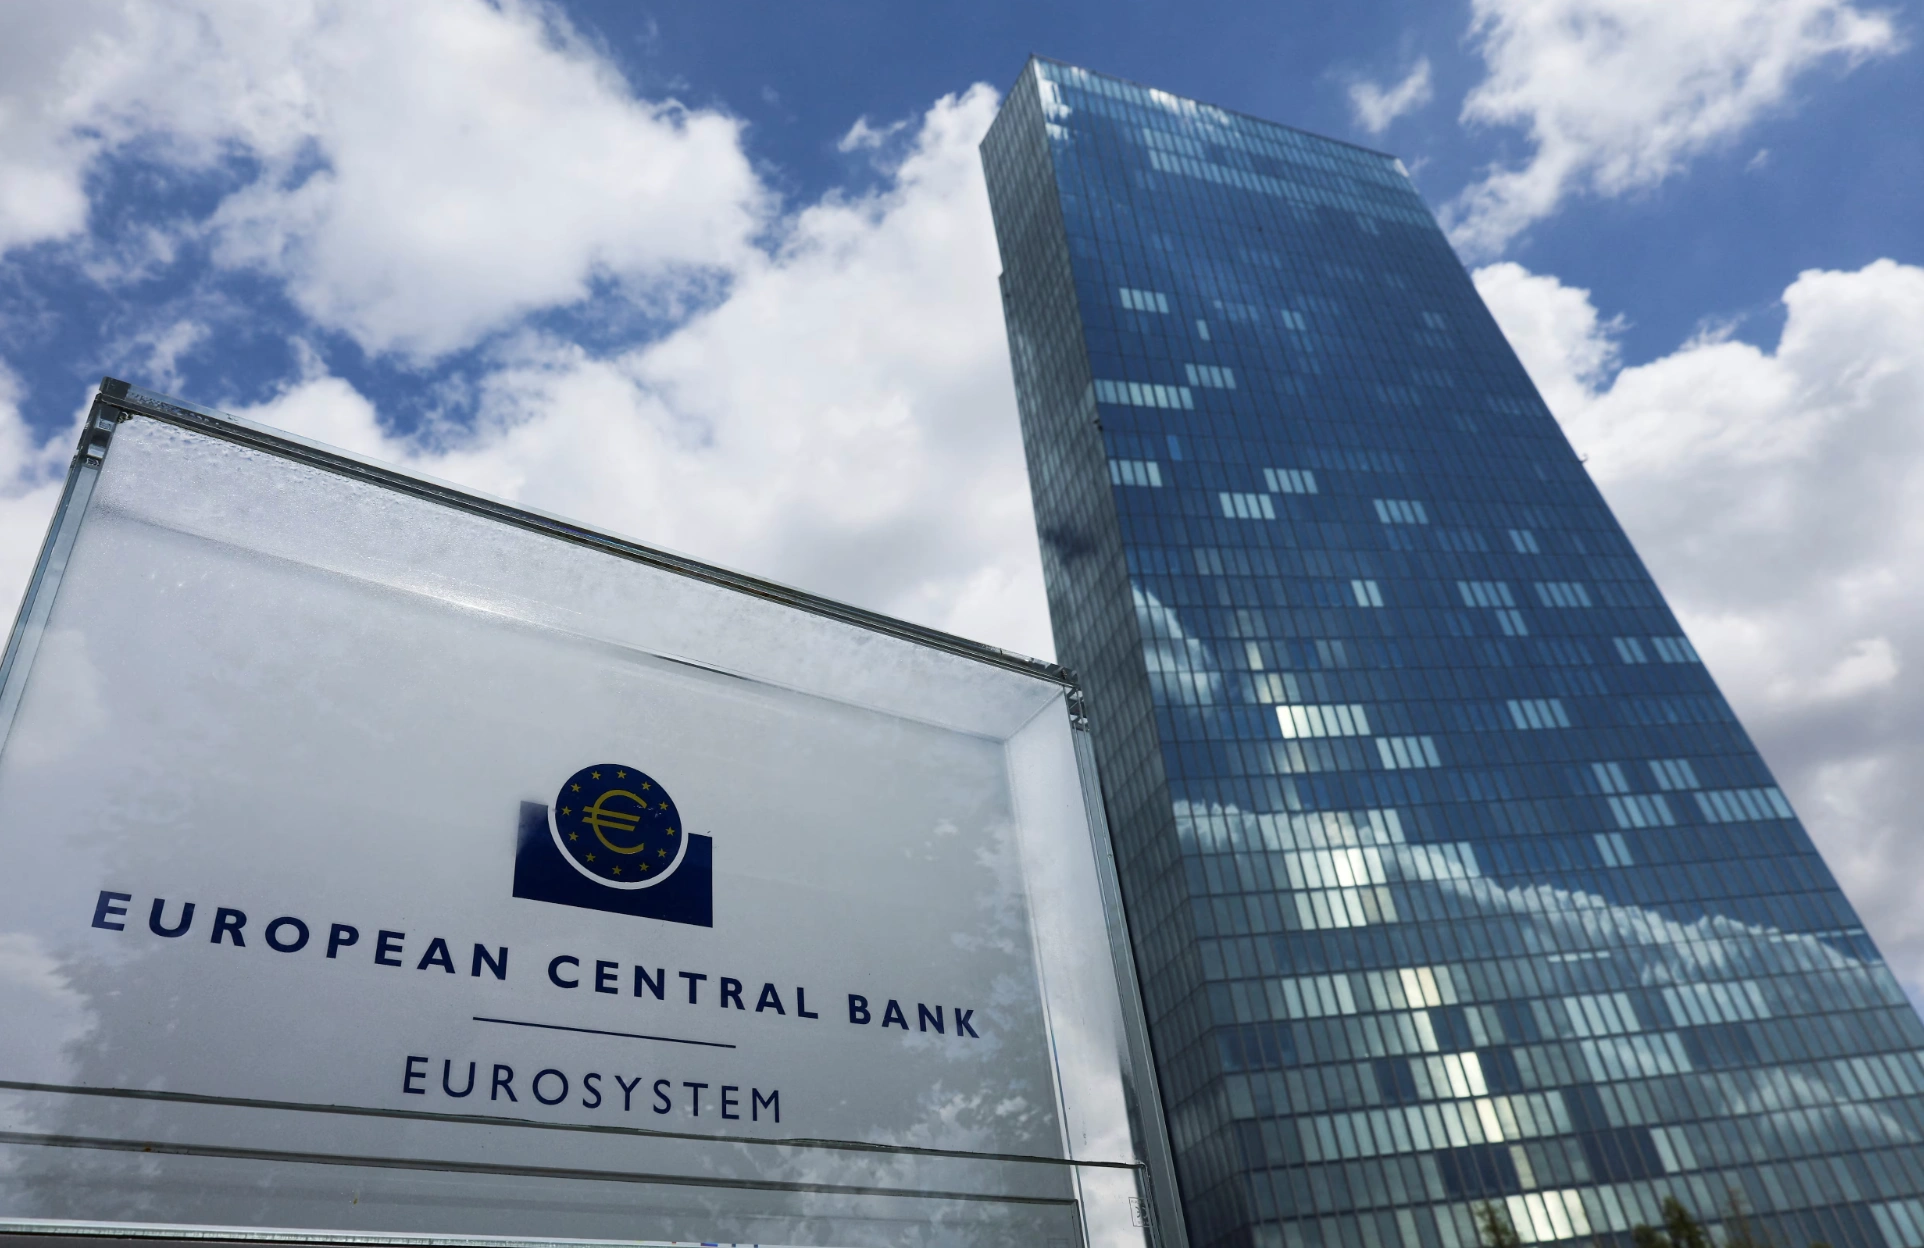
While U.S. growth softens, the global central bank landscape has fractured into a divergence map unlike anything seen since the tightening cycles of 2022–2023. The ECB moved 40 basis points in its latest meeting, lifting the deposit facility rate to 2.65% from 2.25% — aggressive tightening into a eurozone economy already contending with slowing growth and the inflation shock from the 2026 Iran war. The ECB's move is the mirror image of the Fed's: both institutions are hiking into deteriorating growth conditions because inflation has not cooperated with the disinflationary script written in late 2024.
At the opposite extreme, the Swiss National Bank cut its policy rate to 0.0% — from 0.5% — explicitly to combat deflation risks and curb Swiss franc appreciation. The SNB and the ECB are both in Europe, operating in closely linked economies, and are now 265 basis points apart in policy rate terms. That spread has direct consequences for euro-franc currency dynamics and for the broader European financial system's funding conditions. The Bank of England holds at 3.75%, sitting between the ECB's tightening impulse and the SNB's emergency easing. Japan's central bank holds at 1.0% — a historic high by BoJ standards — after years of negative rates, adding yen volatility to an already complex global FX picture.
In the Americas, Brazil's Selic rate stands at 14.0% after a 25 basis point cut, with markets pricing an additional 100–150 basis points of easing ahead. The contrast between Brazil's 14.0% and the SNB's 0.0% represents the full 1,400-basis-point span of global monetary policy in a single quarter — the kind of divergence that historically produces dislocations in carry trades, emerging market capital flows, and dollar-denominated debt servicing costs. With the U.S. dollar index sensitive to both Fed rate expectations and global risk appetite, today's combination of soft GDP and hot PCE puts the DXY in a technically ambiguous position: higher rates support the dollar, but slower growth and stagflation risk eventually undermine it.
What Traders Watch Next
The dollar is the single most important instrument to monitor as the global divergence theme plays out into Q4. A Fed hike in October while the ECB also tightens and the SNB sits at zero creates a multi-directional currency stress that historically resolves through volatility, not smoothly. EUR/USD, USD/JPY, and USD/CHF are all in play simultaneously, and positioning in the DXY heading into October 28 will need to account for the scenario where the Fed pauses while the ECB continues — a reversal of the rate differential dynamic that drove dollar strength through much of 2025.
For U.S. equity traders, the 1.5% Q2 GDP final print combined with the -2.1% 2027 forecast is not priced into forward earnings estimates that were built on the 2.3% full-year growth assumption. If Q3 GDP — due in late October — shows further deceleration toward the 1.0%–1.2% range, the earnings revision cycle will accelerate sharply in the November reporting season. Cyclicals, financials, and consumer discretionary sectors carry the most downside exposure in that scenario; defensive sectors and short-duration fixed income become the logical offset.
The geopolitical wildcard embedded in every projection is the 2026 Iran war, which has already complicated ECB inflation modeling and introduced a persistent oil price risk premium. Any escalation in that conflict before the October 28 FOMC meeting would hit both the growth and inflation inputs simultaneously — the worst possible combination for a committee already navigating stagflation risk with a 3.75%–4.00% policy rate and a growth profile that, by the Fed's own data, is deteriorating. The specific level to watch on growth: if Q3 GDP prints below 1.0% annualized, the October hike debate becomes a hold debate overnight, regardless of what PCE does between now and then. That number drops October 30 — two days after the FOMC decision. Sequence matters.
The Weekly Investor
Daily market analysis for active traders. Free.