Fed's Hike Signal Hardens as PCE Hits 4.1%
PCE inflation jumped to 4.10% in May, core PCE hit 3.40%, and the Fed's dot plot now signals a 2026 hike. What traders must know before July 2.
Key Points
- PCE inflation surged to 4.10% YoY in May — up 30 basis points in a single month — while core PCE rose to 3.40%, running above the Fed's own 2026 forecast of 3.3%.
- Nine of 19 FOMC members now favor at least one rate hike this year, with the median end-2026 dot shifting up 40 basis points to 3.8%, gutting any residual easing narrative.
- Fed Chair Warsh speaks at the ECB's Sintra symposium Wednesday at 9:30 a.m. ET — his first major post-FOMC public appearance — and the June payrolls report drops Thursday at 8:30 a.m. ET.
PCE inflation hit 4.10% year-over-year in May — a 30-basis-point jump in a single month — and the Federal Reserve's own projections are already lagging the data. With core PCE at 3.40% and running above the FOMC's freshly upgraded 3.3% forecast, the committee that held rates at 3.50%–3.75% two weeks ago now has a math problem: its own framework is pointing toward a hike before year-end, and market pricing is catching up fast.
The Fed's Inflation Problem Is Getting Worse
The May PCE release, published June 25, delivered the clearest evidence yet that the Fed's post-2025 easing cycle was premature. Headline PCE at 4.10% is more than double the 2% target. Core PCE at 3.40% — which strips out food and energy — is up from 3.30% in April and sits 140 basis points above target. That means even the component most insulated from Middle East energy disruption is moving in the wrong direction.
Compare that to where the FOMC thought it would be. The June Summary of Economic Projections — Warsh's first as Chair — penciled in core PCE at 3.3% for full-year 2026. May's single-month read already exceeds that. The broader CPI data reinforces the picture: CPI-U rose 4.2% YoY through May, and CPI-W — the wage-earner measure — ran even hotter at 4.4%. The month-over-month CPI gain of 0.6% was not a rounding error. These are not base-effect artifacts. Inflation is reaccelerating on multiple measures simultaneously.
The transmission mechanism is no mystery. The Iran conflict that escalated in late spring drove WTI crude to $81.36 per barrel and Brent to $81.00 — levels that feed directly into transportation, manufacturing input costs, and consumer energy bills. But the Fed's preferred diagnosis — that energy is the culprit — is harder to sustain when core PCE, which excludes energy, is itself accelerating. That tells you price pressure has broadened into services, shelter, and non-energy goods. That is the stickier, more structurally damaging inflation regime.
What the Dot Plot Actually Said
The June 17 FOMC decision was unanimous on the rate hold, but the dot plot told a completely different story. Nine of 19 participants now expect at least one rate hike in 2026. Eight expect no change. One expects a cut. The median end-2026 dot shifted from 3.4% in March to 3.8% — a 40-basis-point upward revision that, if realized, means the next move is up, not down. The most hawkish participant sees the rate at 4.375% through 2027, suggesting a full 75-basis-point hike cycle could be on the table if inflation stays elevated.
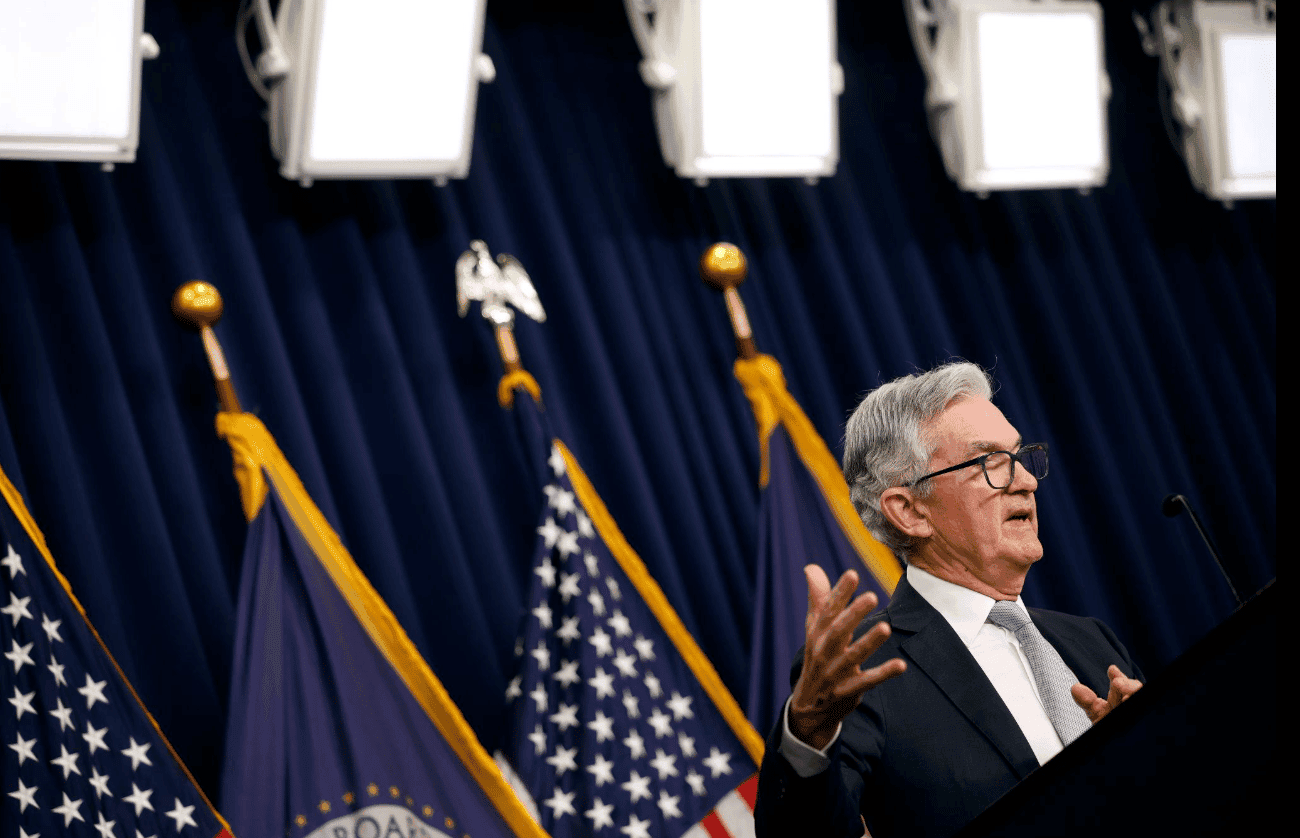
Warsh's post-meeting press conference left little ambiguity. He acknowledged that inflation has run "well ahead" of the 2% target "for more than five years," called elevated prices "a burden for the American people," and stated that the FOMC is "unambiguous and unanimous" in its commitment to price stability. That is not the language of a Chair who thinks the next move is a cut. The statement itself reinforced the hawkish pivot: prior language that had been read as an easing slant was removed entirely, and any indication of a 2026 cut was scrubbed. Rate reductions are now projected for 2027 and 2028.
The market has adjusted accordingly. CNBC reported that in the wake of the decision, traders began pricing a hike as early as October. The 10-year Treasury yield sits at 4.38% and the 2-year at 4.07%, producing a 31-basis-point positive spread — a curve that has been re-steepening as the market prices out cuts and prices in hikes. SOFR at 3.62% and the effective fed funds rate at 3.63% confirm the rate is sitting at the top of the 3.50%–3.75% target band, leaving almost no buffer before the committee would need to formally act.
The structural review Warsh announced — five task forces covering communications, the balance sheet, data reliance, productivity, and the inflation framework itself — is not a cosmetic exercise. Expecting conclusions "by year-end," it signals the new Chair intends to reorient the institution around a harder inflation mandate. That is a multi-quarter headwind for rate-sensitive assets regardless of what any single data point shows.
What Traders Watch Next
The calendar is brutal this week. Thursday, July 2, brings the June nonfarm payrolls report — released a day early ahead of the Independence Day holiday — with consensus at 172,000 jobs. That would match May's print and extend a Q2 average well above Q1's 73,000 monthly pace. A strong number at or above consensus removes one of the last arguments against a hike: that the labor market is softening enough to justify patience. April came in at 179,000. May came in at 172,000. If June lands above 170,000 again, the October hike probability will reprice sharply higher.
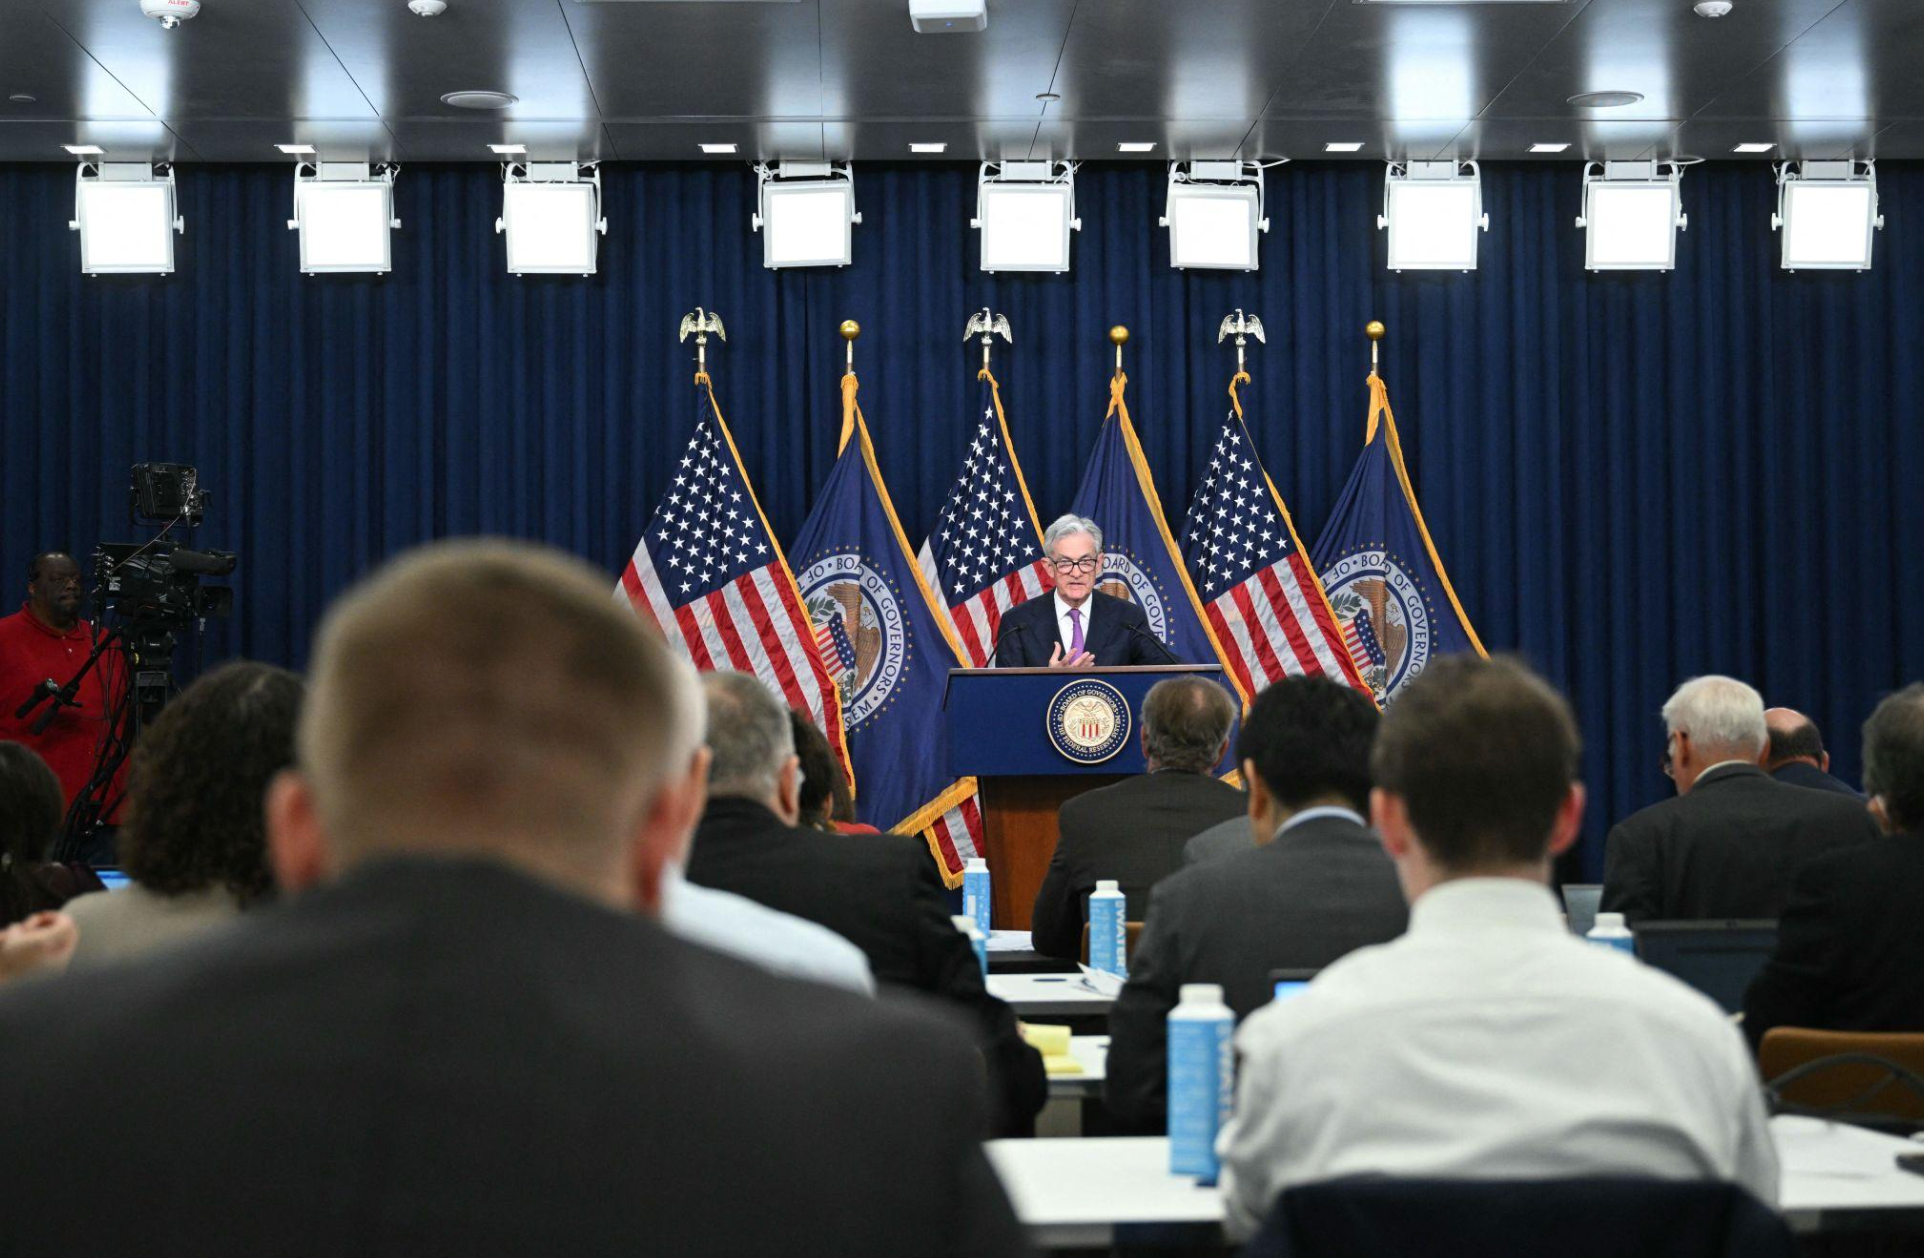
Before that, Wednesday brings the more immediate catalyst. Fed Chair Warsh speaks at the ECB's Sintra symposium at 9:30 a.m. ET — his first major public appearance since the June 17 meeting. Sintra is the forum where central bankers have historically moved markets with unscripted hawkish pivots. The symposium theme is "shaping Europe's future," but Warsh will face questions about the U.S. inflation trajectory, the dot plot shift, and the October hike timeline. Any language tightening the bar for a hike — or lowering it — will hit Treasury yields within minutes.
The next CPI release covering June data is scheduled for July 14 at 8:30 a.m. ET. That is the fulcrum print for the September FOMC meeting. If June CPI comes in at or above May's 0.6% month-over-month pace, the committee's 3.3% core PCE full-year forecast is effectively broken, and the October hike scenario becomes baseline, not tail risk. The 10-year yield at 4.38% is the level to watch: a sustained break above 4.50% before the July 14 CPI print would signal the market is pricing the hike before the Fed formally signals it. Position accordingly.
The Weekly Investor
Daily market analysis for active traders. Free.