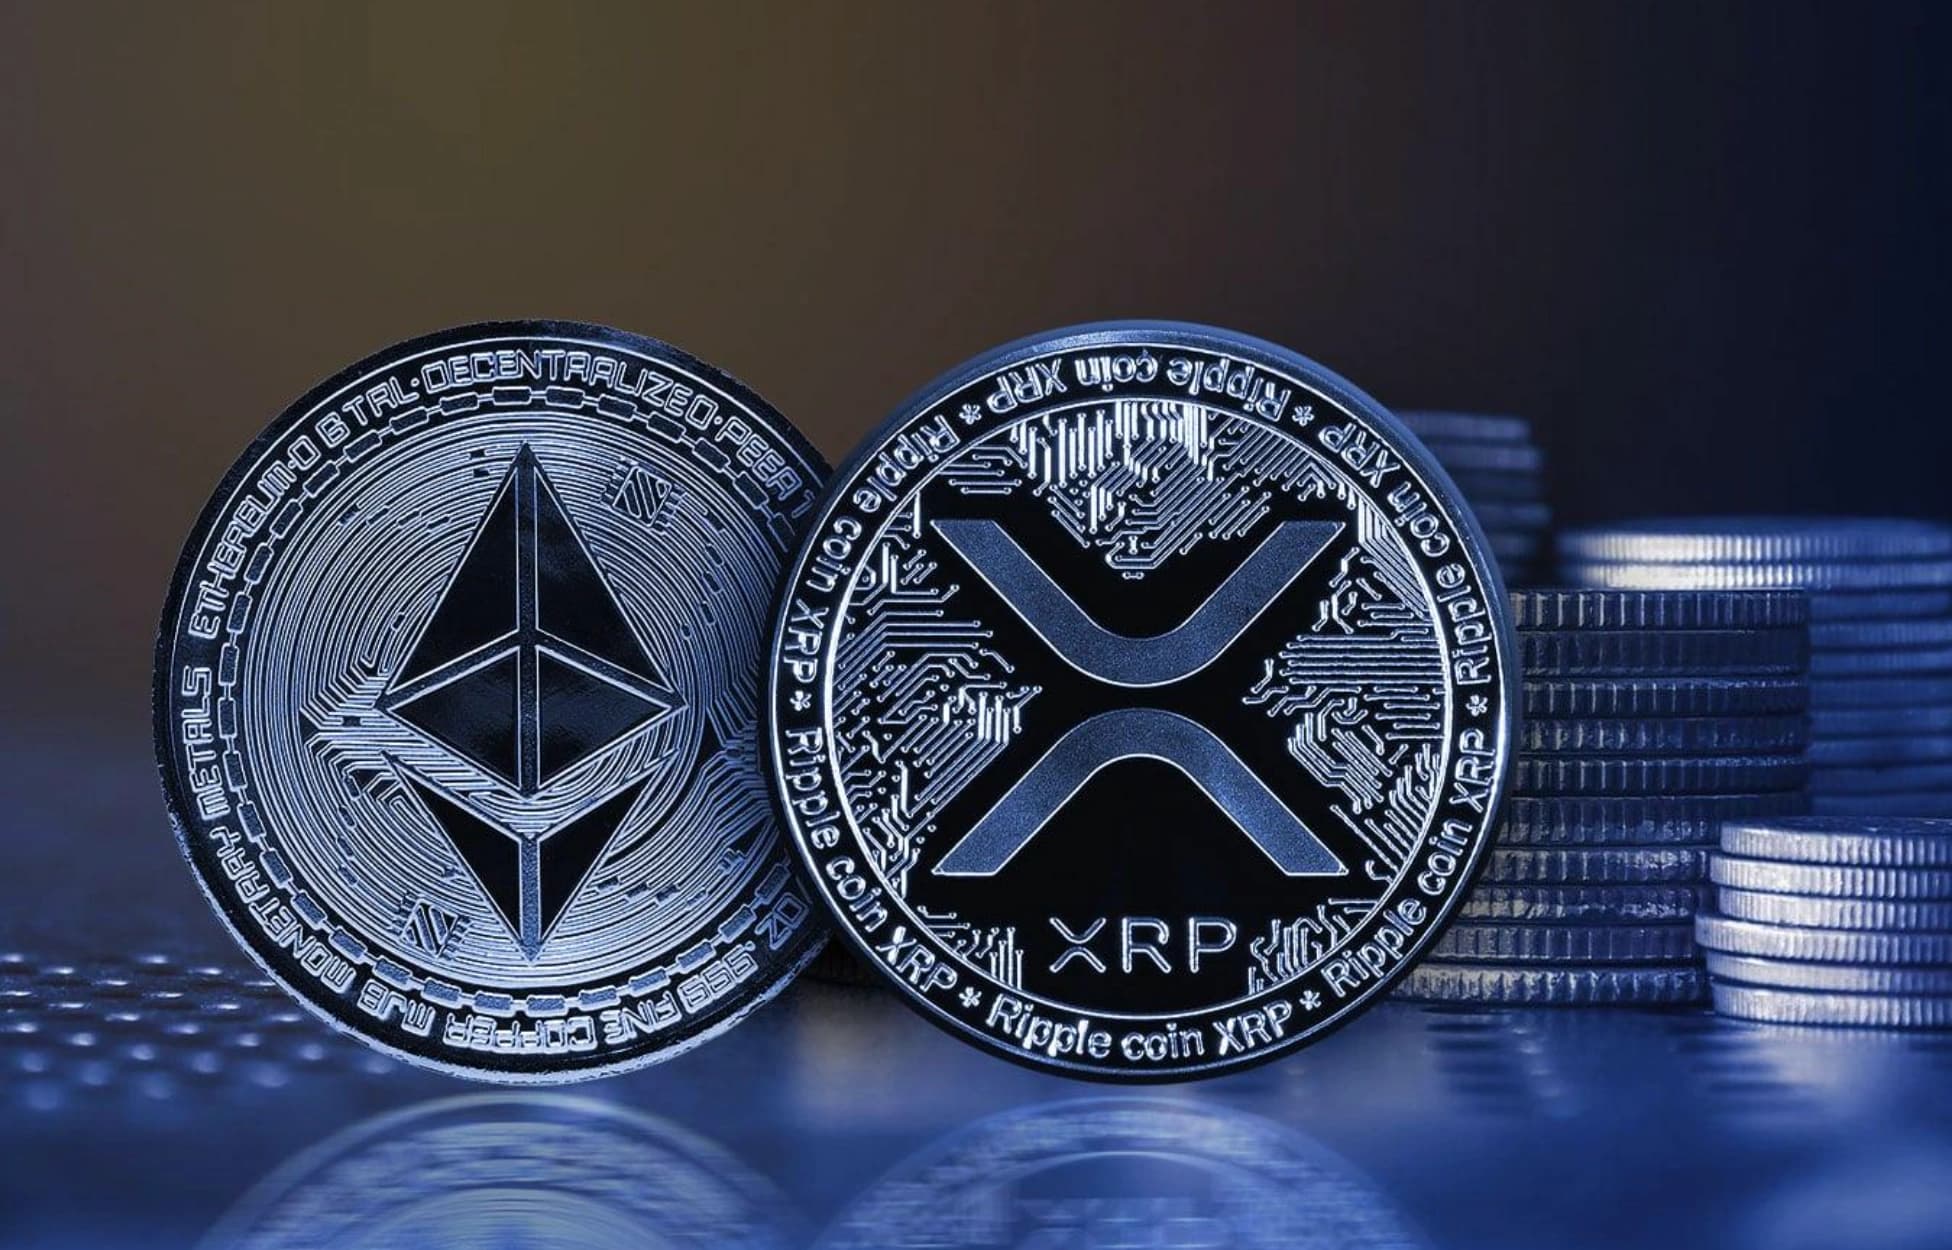
ETH Hits $1,570 as Altcoins Bleed Into Q3
Ethereum trades 5% above its 52-week low at $1,570, with RSI at 29.3 and $528M in June ETF outflows. XRP, SOL, and HYPE diverge sharply.
Key Points
- Ethereum is trading at $1,569.81 — just 5% above its 52-week intraday low of $1,507 set June 6 — with RSI at 29.30 and price below every major moving average from the 20-day to the 200-day.
- Spot ETH ETFs recorded 17 consecutive days of net outflows totaling $401 million, with funding rates negative and open interest declining — signaling a leverage flush, not capitulation into a new uptrend.
- Solana and Hyperliquid are the only major assets attracting net institutional interest, with HYPE ETFs leading all crypto products at $161 million in June inflows while ETH and BTC bleed out.
Ethereum is trading at $1,569.81 on the first day of Q3 2026, sitting 5% above a 52-week low set less than four weeks ago, with every moving average above it pointing down and 17 straight days of spot ETF outflows now totaling $401 million. The asset has lost 37% of its value year over year. Among major altcoins, the picture is almost uniformly negative — except for two names that are telling a very different story about where institutional dollars are actually going.
ETH's Technical Collapse
The Ethereum daily chart as of July 1 is a clean illustration of a bear trend with no technical floor in sight. Price opened the session at $1,567.83, briefly touched $1,586.47, and dropped to a low of $1,512.04 before stabilizing near current levels. More consequential than intraday range is the moving average stack: ETH is trading below its 20-day EMA at $1,708, its 50-day EMA at $1,865, its 100-day EMA at $2,036, and its 200-day EMA at $2,317. That is a complete bearish alignment across every standard timeframe — not one of those levels is within reach without a sustained, multi-week reversal of current trend.
The 14-day RSI at 29.30 places ETH in technically oversold territory, nearly identical to Bitcoin's 29.90 reading. The difference is that ETH's oversold condition arrives from a higher relative drawdown — down 37% year over year versus the roughly 30% first-half loss on BTC — meaning the mean-reversion distance required to recover even to neutral is substantially larger. The 52-week high of $4,954, reached on August 24, 2025, now sits 215% above current price. That is not a recovery thesis; it is a measure of how far the market's repricing of ETH's value proposition has gone.
The $1,600 horizontal support level has emerged as the critical near-term floor. ETH has been consolidating just above that level, and the daily candle's low of $1,512.04 tested below it intraday before recovering — a concerning signal that suggests the market is probing for sellers at every available margin. Immediate resistance sits at $1,700 to $1,750. Without a decisive 4-hour close above that range on meaningful volume, any bounce is technically a dead-cat structure operating within the existing downtrend. A confirmed break below $1,600 on a closing basis opens the path to $1,400, a level that carries no historical support from the current cycle.
Where the Money Is Actually Going
The altcoin landscape on July 1 is not uniformly negative — it is selectively negative in a way that reveals where institutional and retail flows have rotated. CoinDesk's live data as of approximately 01:00 UTC shows Solana at $74.16, up 0.16% — the only green name among the major assets at that hour. XRP is at $1.04, down 0.75%. BNB sits at $551.20, down 1.16%. TRX is at $0.32, essentially flat. Hyperliquid's HYPE token is at $61.48, down 0.76% on the session but sitting on a very different monthly story than the rest of the field.
The ETF flow data is where the divergence becomes actionable. While Bitcoin ETFs bled $4.5 billion and Ethereum ETFs shed $528.99 million in June, XRP ETFs pulled in $59.46 million in net inflows over the same period. Hyperliquid ETFs led the entire crypto ETF category with $161.05 million in June inflows — the strongest monthly showing across all products. That is not noise. It represents a deliberate rotation by investors who did not exit crypto entirely but instead moved down the liquidity curve toward assets with specific narratives: XRP's legal clarity following years of SEC litigation, and Hyperliquid's positioning as a decentralized perpetuals exchange with genuine protocol revenue.
Solana's resilience is supported by positive ETF flow sentiment and its growing institutional role as the primary alternative to Ethereum for smart contract deployment. With a market cap of $41.9 billion — less than two-thirds of XRP's $64.0 billion but with substantially higher developer activity — Solana's relative strength on a day when everything else is red is a meaningful signal. Investors rotating out of ETH are not uniformly going to cash; a measurable portion is going to SOL.
The Bit Digital development is perhaps the most pointed institutional signal in the altcoin space this week. CEO Sam Tabar confirmed the firm is actively selling its Bitcoin holdings to build an Ethereum and AI-focused position — a direct institutional bet that ETH's current price represents a structural discount rather than fair value. That thesis requires either a significant improvement in ETH's on-chain utility metrics or a macro shift that lifts all crypto assets, but the fact that a publicly traded mining company is making that call at a 52-week-low vicinity is worth tracking.
The Regulatory and Structural Picture
Three regulatory developments are shaping the altcoin and stablecoin landscape heading into Q3. Yahoo Finance's coverage of the stablecoin sector flagged Circle's 17% single-session crash after Stripe, Coinbase, and BlackRock backed Open Standard's Open USD — a rival stablecoin network that allows partners to retain reserve income and eliminates minting fees. That directly attacks USDC's business model at the revenue line, and the market's reaction priced the disruption immediately. For traders with exposure to any asset that depends on USDC liquidity depth, the structural implications of a well-capitalized competitor entering the space are not short-term.
The UK's Financial Conduct Authority proposed lowering stablecoin capital buffers below the EU's MiCA requirements — a direct competitive positioning move that signals regulatory arbitrage is accelerating globally. Taiwan passed sweeping new crypto legislation requiring licensing, reserve mandates, and tough penalties, which now heads to the President for signature. Neither development is a near-term price catalyst, but both reflect a global regulatory trajectory toward legitimization with compliance costs — a headwind for smaller altcoins that lack the capital to meet new standards and a relative tailwind for the larger, more regulated names.
The Clarity Act's Senate timeline remains the biggest domestic regulatory variable. Jefferies' warning of volatility around the vote cuts both ways: a passage scenario would provide the clearest institutional framework the U.S. market has had, with immediate implications for ETF product expansion and custody infrastructure investment. A delay scenario prolongs the current period of ambiguity that has, in conjunction with macro headwinds, contributed to the Q2 outflow environment. For Ethereum specifically, clarity on whether ETH is classified as a commodity under any new framework would be the single most important regulatory data point for the asset's institutional demand curve heading into the second half of 2026. Watch the Senate calendar through mid-July — any scheduling confirmation on the Clarity Act floor vote is the signal that matters most for the altcoin complex between now and the end of the month.
The Weekly Investor
Daily market analysis for active traders. Free.