Energy ETFs Lead 2026 at +39%; XLY Hits -8.7%
XLE has surged 39.1% YTD in 2026 as AI power demand and oil prices drive energy stocks. Consumer Discretionary ETF XLY is the year's worst sector at -8.7%.
Key Points
- The SPDR Energy Select Sector ETF (XLE) has returned 39.1% year-to-date through September 28, more than doubling the second-best sector's gain and outpacing XLY's -8.7% by nearly 48 percentage points.
- AI data center power demand, elevated oil and gas prices, and strict capital discipline among energy producers are the three compounding catalysts driving the sector's dominant 2026 performance.
- Traders should monitor whether the Global X LLM ETF (LLMA), launched October 1, absorbs flows that might otherwise have gone into semiconductor ETFs — particularly SOXX, which is up 84.7% YTD but faces increasing competition for thematic capital.
The most important sector trade in 2026 has not been artificial intelligence — it has been the energy stocks powering artificial intelligence. The SPDR Energy Select Sector ETF (XLE) has returned 39.1% year-to-date through September 28, leading all 11 S&P 500 sectors tracked by SPDR ETFs and outpacing the second-place Technology sector's 35.1% gain by four full percentage points. Consumer Discretionary (XLY) sits at the opposite extreme at -8.7% YTD, producing a nearly 48-percentage-point spread between the best and worst sectors — one of the widest such dispersions in recent memory.
Why Energy Is Running the Table
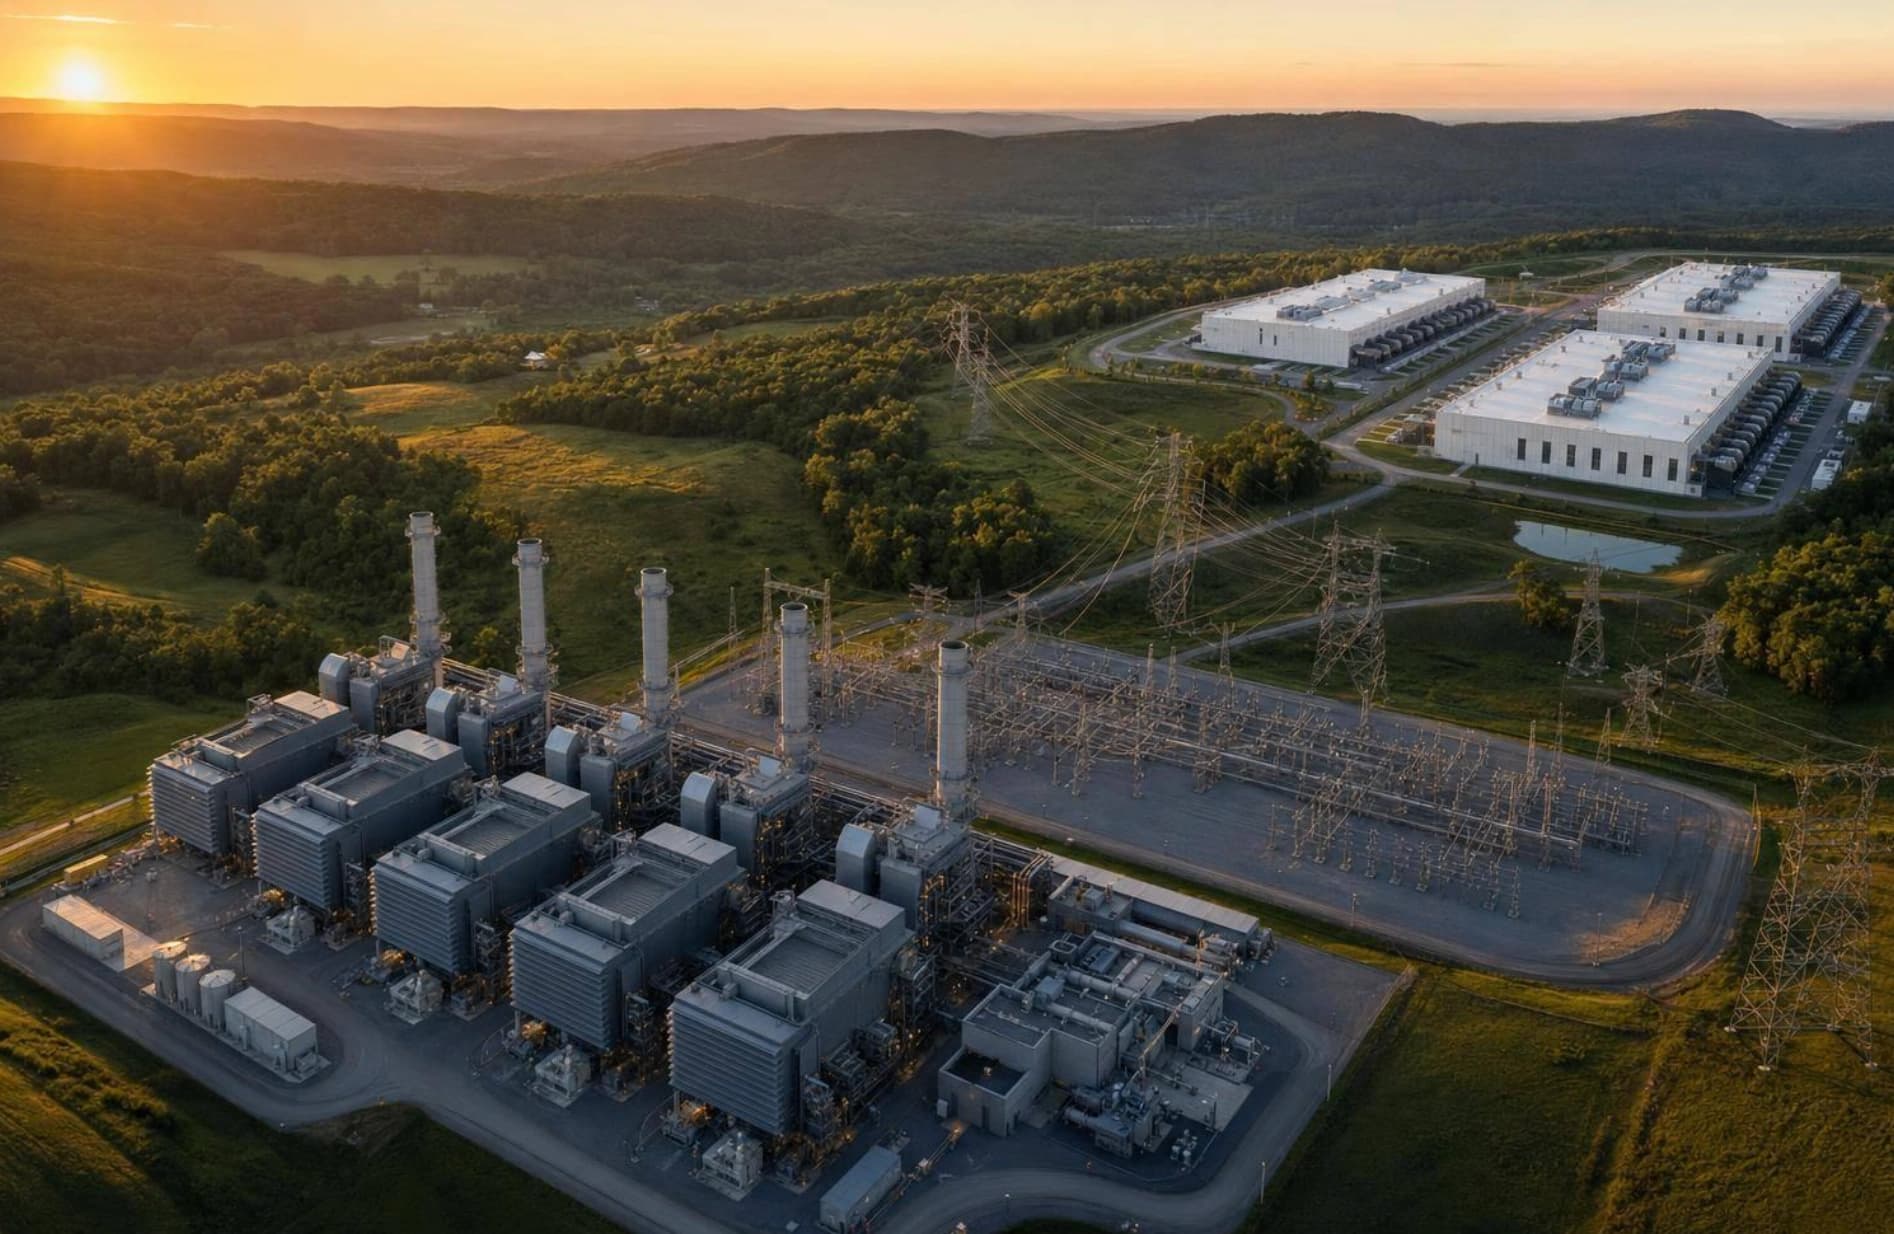
Three forces are stacking on top of each other in the energy trade, and none of them shows meaningful signs of reversing. First, oil and gas prices have remained elevated throughout 2026, providing the revenue baseline that energy company earnings require. Second, AI data center build-out has created a power demand surge that caught utilities and grid operators flat-footed — and energy producers, particularly natural gas companies, have stepped into that gap as the most reliable source of incremental electricity generation at scale. Third, the sector has maintained the capital discipline that characterized the post-2020 era: companies are returning cash to shareholders rather than drilling aggressively, which keeps supply constrained and margins wide.
The numbers at the sub-sector level make the broader XLE return look modest by comparison. The United States Gasoline Fund LP ETF (UGA) — with $190.2 million in AUM and a 1.02% expense ratio — has returned 147.9% year-to-date. The Invesco DB Energy Fund ETF (DBE), running $122.8 million in AUM at a 0.75% expense ratio, has posted a 114.0% YTD gain. Even the US Oil Fund (USO), with $2.5 billion in AUM, leads all ETFs tracked year-to-date at +90.4%. These are commodity futures products, not equity wrappers, and their performance reflects the degree to which the underlying commodity price appreciation has exceeded even the strong equity gains in the sector. For traders who wanted maximum energy exposure in 2026, the futures-based products — despite their structural roll costs and higher expense ratios — outperformed the equity ETF by a factor of roughly two to three times.
Semiconductors Run Second, But the Gains Are Uneven
The iShares Semiconductor ETF (SOXX) is up 84.7% year-to-date with $46 billion in AUM, making it the highest-returning major equity ETF of 2026 by a substantial margin. But the composition of those returns inside the fund tells a more complicated story. Micron Technology (MU) has climbed approximately 276% in 2026. Intel (INTC) is up roughly 223%. AMD has gained approximately 181%. Nvidia — the fund's top holding at roughly 19% of assets — has risen only about 23%, trading near $230. SOXX's 84.7% YTD return is therefore not a rising-tide story. It is a turnaround story, driven by the dramatic re-rating of previously undervalued memory and legacy-chip names while the market's most visible AI chip company has underperformed the fund it anchors by more than 60 percentage points.
This internal dispersion inside SOXX has significant implications for traders considering new positions. Buying SOXX at current levels means accepting Nvidia as a nearly one-fifth weight in the portfolio at a time when Nvidia's individual return has badly trailed the fund. The names that have driven SOXX's gains — MU at +276%, INTC at +223% — are coming off multi-year underperformance and may now be pricing in much of their recovery. Traders who want semiconductor exposure without the Nvidia concentration drag would need to construct that position carefully, either through single-stock selection or through equal-weight alternatives. The iShares Global Clean Energy ETF (ICLN), for context, has returned only 3.1% YTD — illustrating how sharply the market has bifurcated between fossil fuel and clean energy infrastructure even as the AI power demand narrative theoretically benefits both.
New Launches Add a Fresh Competitive Angle
The ETF product landscape entering Q4 is more crowded than at any point in history, with over 1,000 new funds launched in 2026 — a 52% surge year-over-year. That volume is not incidental to the sector performance story. Capital that might once have been forced into broad sector ETFs now has a more precise routing mechanism. Global X launched the Global X LLM ETF (LLMA) on October 1, targeting companies building and deploying large language models — a product that competes directly with SOXX and XLK for thematic AI capital, but with a tighter mandate. Global X also launched the MLCC & Electronic Components ETF (MLCC) in September, targeting manufacturers of multi-layer ceramic capacitors used in AI servers, electric vehicles, and smartphones. These are not broad market plays; they are designed to route capital to the specific components of the AI infrastructure stack that investors want to overweight.
On the global side, Nomura launched the NEXT FUNDS Solactive Global Memory Index ETF — a direct expression of the memory chip recovery trade that has powered MU and INTC inside SOXX. If that product attracts meaningful assets, it creates an interesting dynamic: global ETF capital could flow into the same underlying stocks that are already driving US-listed SOXX's outsized gains, providing a secondary bid for names like Micron from non-US institutional buyers. Meanwhile, HANetf's launch of Europe's first covered call ETF with daily options expiries (QQQI) and WisdomTree's defined return ETFs reflect how the product innovation cycle is extending beyond simple long exposure into structured outcomes — a sign that at least some institutional buyers are beginning to hedge the extraordinary YTD gains in equity-side thematic funds.
The worst-performing global sector ETFs of 2026 sharpen the picture further. CSI Overseas China Internet ETFs are down 24.93%, Hang Seng TECH ETFs have fallen 18.60%, the Solactive China Electric Vehicle and Battery ETF is off 17.51%, and the S&P India Tech ETF is down 17.49%. The common thread is Asia-Pacific technology exposure — a sector grouping that has given back sharply even as US semiconductor and energy names have surged. For traders running global sector allocations, that divergence — US energy and semis up 39% to 85%, Asia-Pacific tech down 17% to 25% — represents one of the most actionable mean-reversion setups or momentum-continuation debates heading into Q4.
The specific level to watch for XLE is the 40% YTD return threshold, which the fund is approaching with roughly three months remaining in the year. A sustained crude oil price above $85 per barrel — combined with continued AI infrastructure spending announcements from hyperscalers — would likely push XLE through that mark before year-end. Conversely, any macro demand shock that resets oil prices toward $70 would compress energy sector margins quickly, given how much of the current equity valuation is predicated on the elevated price environment holding. Q4 earnings season for energy majors, beginning in mid-October, will be the first hard test of whether the three-catalyst thesis — prices, AI power demand, capital discipline — remains intact or begins to crack.
The Weekly Investor
Daily market analysis for active traders. Free.