
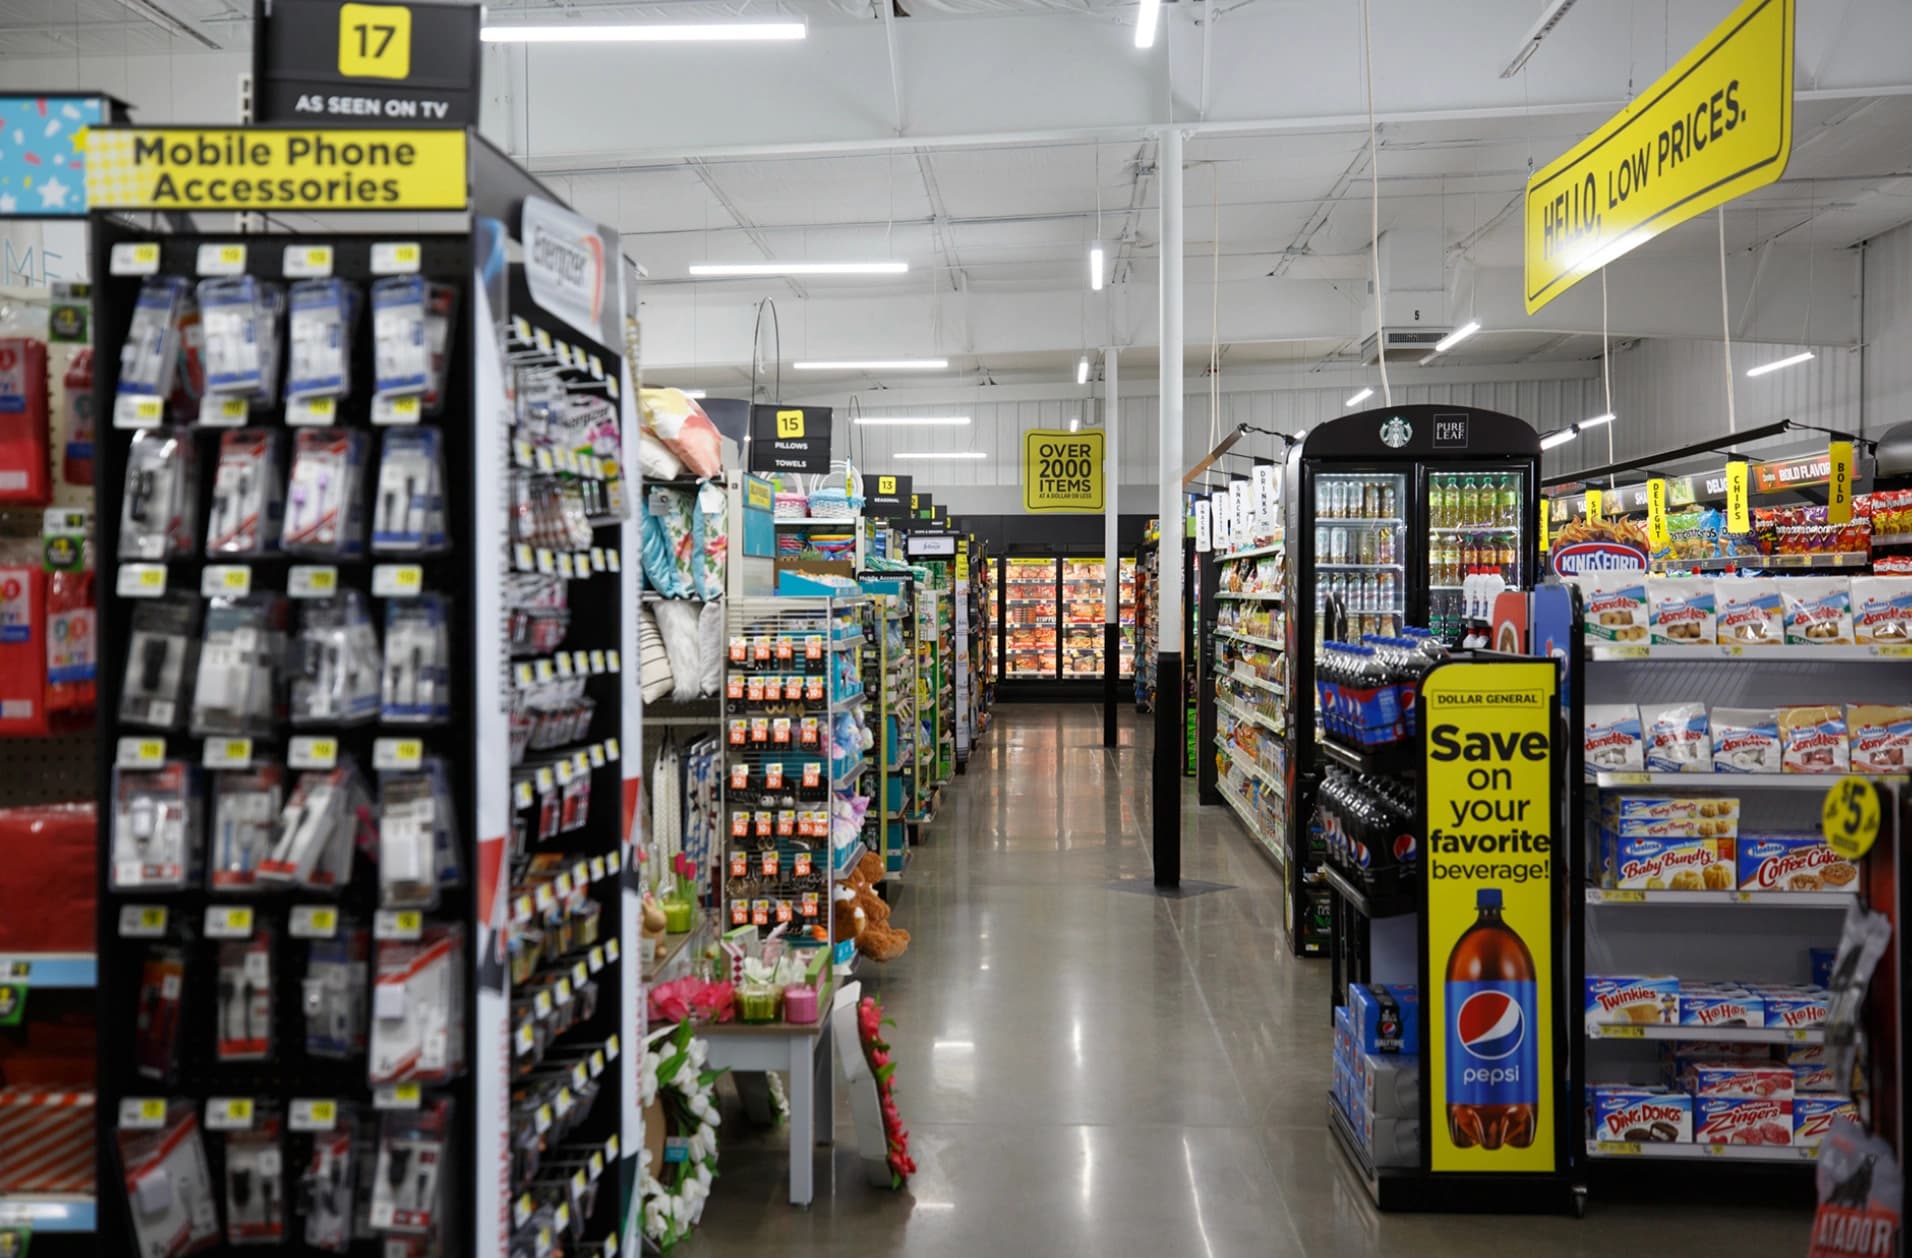
Dollar General and Dollar Tree Report: Retail's Stress Test
Dollar General and Dollar Tree both reported before the open Thursday with options pricing 8-9% swings. What the prints reveal about consumer health at 3.3% CPI.
Key Points
- Dollar General and Dollar Tree both reported Q2 results before Thursday's open with options markets pricing in ±8.59% and ±8.93% swings respectively — among the largest pre-market implied moves of the current earnings season for consumer-facing names.
- With CPI inflation still running at 3.3% year-over-year and core CPI at 2.5% as of July, the dollar store channel sits at the precise intersection of two contradictory forces: trade-down tailwinds from squeezed consumers and margin pressure from sticky input costs.
- The forward guidance language on same-store sales and shrink rates will determine whether these stocks recover their 2025 losses or confirm that the dollar store model faces a longer structural reset.
Dollar General and Dollar Tree walked into Thursday morning's pre-market session carrying the weight of an entire income cohort's spending habits on their quarterly prints, with options markets having priced ±8.59% and ±8.93% maximum expected swings respectively — the kind of implied volatility that signals institutional desks expect a binary outcome, not a muddle-through quarter. Check the Yahoo Finance earnings calendar for the confirmed prints as they clear. What these two reports reveal collectively about the low-to-middle income American consumer is more actionable for traders than either result in isolation, and the macro backdrop makes the read-through unusually clean.
The Consumer These Stocks Actually Serve
Dollar General's core customer earns under $40,000 a year. Dollar Tree's Family Dollar banner serves a similar demographic, while the flagship Dollar Tree stores skew slightly higher — but not by much. This distinction matters enormously when you set it against the current macro tape: CPI inflation running at 3.3% year-over-year as of July, core CPI at 2.5%, and a Fed Funds Effective Rate of 3.63% that has kept credit card borrowing costs elevated even as the Fed has cut from its 2025 peak. The 10-year Treasury yield at 4.64% and the 2-year at 4.17% — an uninverted curve now for several months — reflects a market pricing in sustained nominal growth, but that same rate environment is grinding on the revolving-credit balances that the dollar store customer relies on more than any other income segment.
The trade-down thesis that powered dollar store stocks through the 2022-2023 inflationary surge has become more complicated in 2026. Middle-income consumers who began shopping at dollar stores when gasoline hit $5 per gallon have partially migrated back to traditional grocery and mass-market channels as prices stabilized. That leaves Dollar General and Dollar Tree more dependent on their core low-income customer — a cohort whose wage gains have been real in nominal terms but have been eroded by the compounding effect of three-plus years of above-target inflation. Unemployment at 4.1% as of July suggests the labor market hasn't cracked, but participation and wage growth in the service sector sub-categories most relevant to these consumers has been decelerating since Q1.
Shrink — the industry euphemism for organized retail theft and inventory loss — remains the single most damaging line item for both operators. Dollar General flagged it aggressively in 2024 and 2025, taking inventory control charges that wiped out quarters of operating leverage. The question for today's reports is whether the investments in store-level security, staffing adjustments, and inventory management systems have begun to show up in gross margin recovery, or whether shrink remains a structural drag that the format simply cannot solve at current store densities.
Best Buy as the Other Data Point
Best Buy (BBY) also reported before Thursday's open with options pricing a ±8.32% maximum expected swing, and the read-through to the consumer picture is complementary rather than redundant. Dollar General tells you about essential spending behavior among lower-income households; Best Buy tells you about discretionary big-ticket behavior among the middle tier. If BBY posted a same-store sales beat, it suggests the middle-income consumer is still engaging with replacement cycles in electronics and appliances — a modestly encouraging sign for aggregate demand. If BBY missed on same-store comps or guided down on the second half, it confirms that the consumer durables category is still in contraction, with WTI crude at $87.35 per barrel keeping transportation and energy costs elevated enough to crowd out discretionary spend.
The Brent-WTI spread — Brent at $94.20 versus WTI at $87.35 as of August 21 — reflects ongoing geopolitical risk premium in global crude markets, and that premium flows directly into the cost of goods for every physical retailer in this report batch. Dollar General and Dollar Tree both source heavily from overseas suppliers, and the landed cost of those goods incorporates fuel surcharges that have remained stubbornly elevated. Any gross margin recovery in today's prints would be particularly meaningful against that backdrop, because it would imply either successful price pass-through or meaningful supply chain optimization — either of which has positive read-through implications for the broader consumer staples and discount retail universe.
Hormel (HRL) also reported this morning, adding a protein and packaged food data point to the consumer picture. HRL's core products — Spam, Planters, Jennie-O — skew heavily toward value-oriented households, making its volume data a useful cross-check against Dollar General's consumables traffic. If HRL reported volume declines despite stable pricing, it suggests that even the value food consumer is pulling back, which would be a notably bearish signal for DG's foot traffic assumptions. If HRL volumes held or expanded, it corroborates the thesis that the low-income consumer is still buying necessities but trading within categories rather than walking away entirely.
What the Guidance Language Actually Signals
Same-store sales growth is the metric that separates a structural problem from a cyclical one for dollar store operators. Dollar General's multi-year plan has centered on store remodels, DG Fresh expansion (refrigerated consumables), and private label penetration as drivers of comp acceleration. If today's report shows same-store sales running positive by at least 2-3% — roughly in line with inflation — it suggests the format is holding share even if it isn't gaining it. Anything below flat is a red flag that the trade-down tailwind has fully reversed and that the core customer is stressed beyond the dollar store's ability to capture wallet share.
Dollar Tree's position is more complex because the company has been working through the strategic repositioning of Family Dollar — including store closures, banner conversions, and a potential sale or spinoff that has been discussed at various points over the past 18 months. Any update on that strategic process in today's call carries as much weight as the quarterly numbers themselves, because the Family Dollar discount applies a meaningful valuation drag to the combined entity. A definitive announcement on the Family Dollar resolution — sale, spinoff, or accelerated closure program — could move DLTR more than the EPS print.
For traders, the specific forward-looking levels to anchor on are Dollar General's gross margin guidance relative to its 30-31% historical range and any language on Q3 same-store sales expectations heading into the back-to-school and early holiday planning windows. The next hard catalyst for both names is the September consumer confidence data and the August CPI print due mid-September — if core CPI shows further deceleration toward 2.3% or below, the Fed's path to additional rate cuts becomes clearer, and the dollar store customer's credit burden begins to ease. Until that data lands, today's guidance language is the best real-time intelligence available on whether this cohort of the American consumer is stabilizing or still deteriorating into year-end.
The Weekly Investor
Daily market analysis for active traders. Free.


