CPI's -0.4% Drop Is a Gas Station Mirage
June CPI fell 0.4% MoM — the biggest monthly drop since April 2020 — but core inflation held flat. Here's what it means for the July 29 FOMC.
Key Points
- June CPI fell 0.4% MoM — the largest single-month decline since April 2020 — but the entire move was driven by a 5.7% drop in energy, while core CPI held flat.
- The Warsh Fed's June dot plot already forecast PCE inflation at 3.6% for 2026, and nine of 18 members projected hikes — a one-month gasoline swing changes nothing.
- Watch July 29: with the 10-year at 4.55% and SOFR at 3.64%, the bond market is not pricing a rate cut, and any upside surprise in today's Michigan inflation expectations could reprice the front end fast.
June CPI fell 0.4% month-over-month — the largest single-month decline since April 2020 — and the headline promptly went viral. Traders who bought that headline are making a dangerous mistake. The year-over-year rate is still 3.5%, core CPI is running at 2.6% and went nowhere month-over-month, and the Federal Reserve under Kevin Warsh just revised its 2026 PCE inflation forecast to 3.6% six weeks ago. This is not a pivot setup. This is a gasoline discount masquerading as disinflation.
What the Data Actually Shows
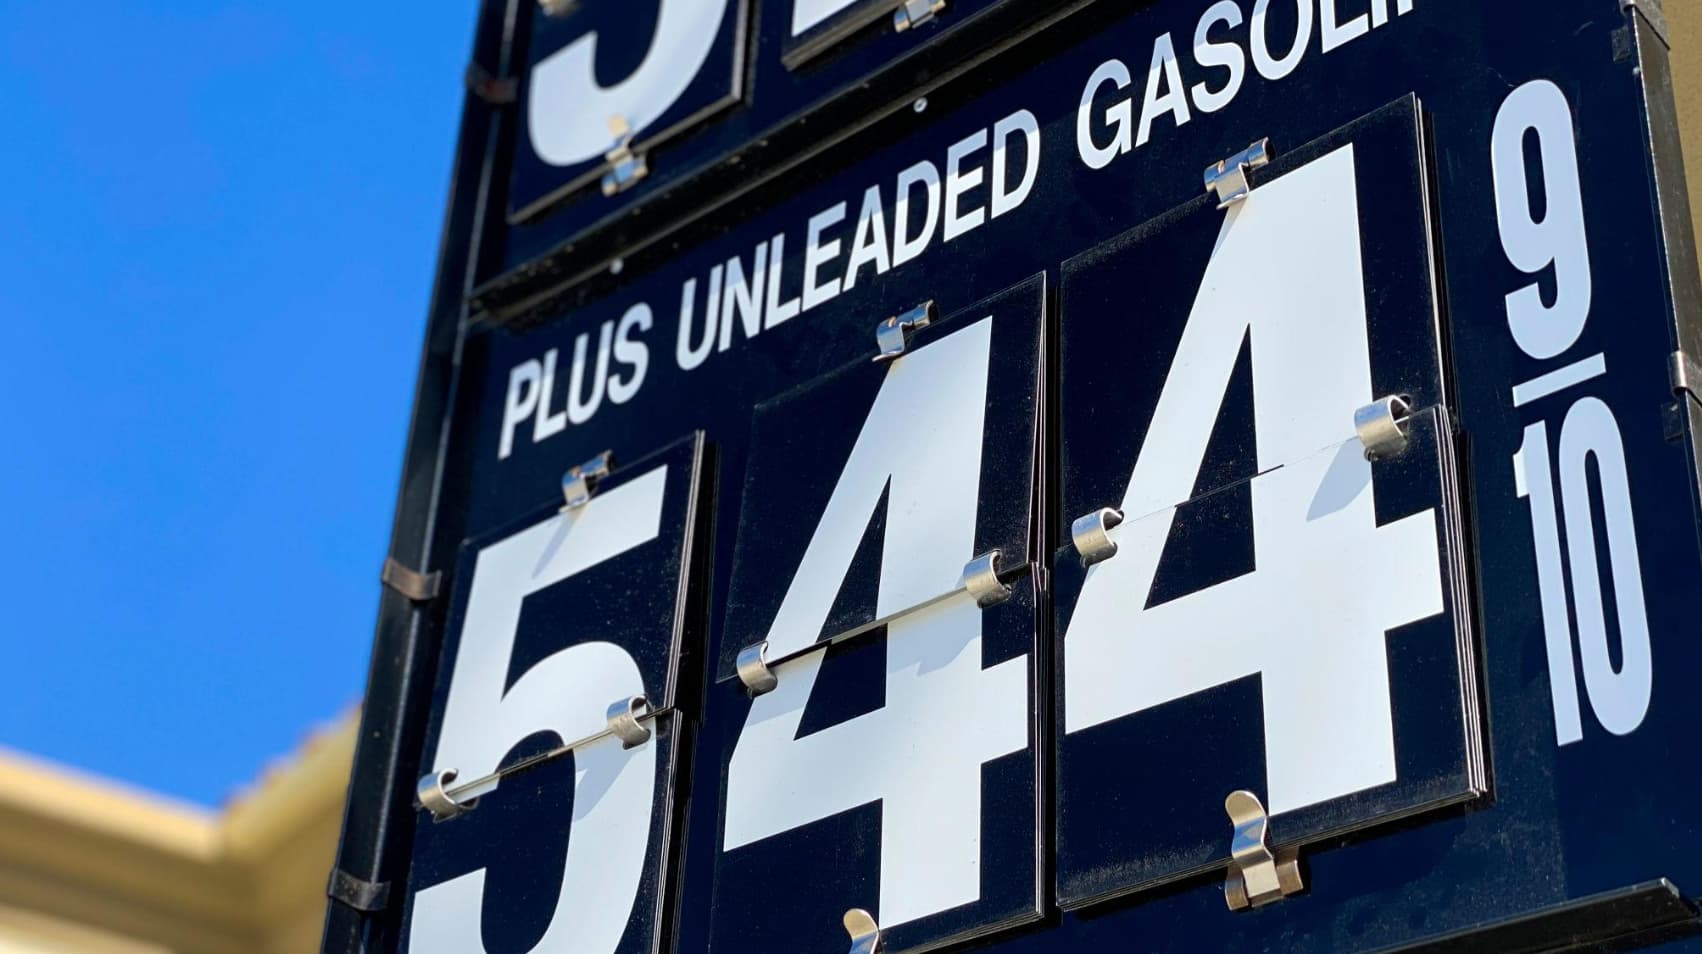
The arithmetic of June CPI is not complicated once you isolate the moving parts. The energy index collapsed 5.7% in a single month after rising 3.9% in May, 3.8% in April, and a massive 10.9% in March. That sequential reversal — almost entirely tied to crude oil market dynamics following ceasefire negotiations in the Middle East — did the entire heavy lifting in the June print. WTI crude settled at $72.26 per barrel as of July 10, down sharply from spring peaks, and the pump-price relief fed directly into the BLS energy calculation. Without that component, headline CPI would have printed essentially flat to modestly positive.
Core CPI — which strips out food and energy — came in at +2.6% year-over-year, unchanged from May on an annual basis and flat month-over-month. Shelter, the single largest component of core, rose another 0.3% in June. That's consistent with the pace seen throughout the first half of 2026, and it reflects the well-documented lag between actual market rents and the BLS's owners' equivalent rent calculation. The shelter contribution alone is running at roughly 150 basis points annualized — more than enough to keep core sticky well above the Fed's 2% target even if every other sub-component behaved perfectly.
The comparison to April 2020 is worth interrogating. That month's -0.8% CPI print came during a total economic shutdown — demand destruction on a scale the U.S. had not seen since the Great Depression, with WTI crude briefly going negative. The June 2026 drop is a supply-side energy reversal during an economy still growing at 2.1% annualized GDP. These are not analogous situations, and traders who treat them as such are conflating two entirely different macro regimes.
The Fed's Problem
Kevin Warsh's first FOMC meeting produced a hawkish restructuring that the market has still not fully digested. The dot plot showed nine of 18 members projecting rate hikes before year-end. The median fed-funds forecast for 2026 moved up to 3.8% from 3.4% in March — implying at least one 25-basis-point increase from the current 3.50%–3.75% target range. GDP was revised down to 2.2%. Most critically, the PCE inflation forecast surged from 2.7% to 3.6%, a near-100-basis-point revision that signals the Fed views the Middle East energy shock as anything but transitory.
Warsh testified before both the House Financial Services Committee and the Senate Banking Committee this week — his first congressional appearance as Fed Chair. He faced pointed questions on policy trajectory and inflation persistence. By all accounts, he did not signal any shift toward easing, and he did not walk back the hawkish dot plot. The Fed's new task forces on monetary policy frameworks, unveiled July 9, reinforce the message: this is an institution reorganizing itself around a longer-run price stability mandate, not one positioning to cut rates.
The market's current pricing deserves scrutiny. SOFR sits at 3.64%, the effective fed funds rate at 3.63% — both consistent with the current target range. But the 10-year Treasury yield at 4.55% and the 2-year at 4.13% tell a different story about where real money is positioned. The 42-basis-point positive spread between the 10-year and 2-year — a curve that has spent much of the past two years inverted — is steepening on stagflation risk, not growth optimism. Inflation at 3.5% with a 10-year at 4.55% implies a real yield of roughly 105 basis points: not tight, but not loose either, and fully consistent with a Fed that has more work to do.
What Traders Watch Next
The July 29 FOMC decision is 12 days away, and this morning's data flow will set the tone heading into the blackout period. Housing starts for June carry a consensus of +13% month-over-month after a brutal -15.4% in May — a bounce that would signal some stabilization in rate-sensitive sectors but won't move the Fed needle. Industrial production is expected up 0.2%, consistent with the modest growth trajectory.
The number that actually matters today is Michigan Consumer Sentiment's long-run inflation expectations, due at 10:00 AM ET. This figure — which fell to 3.3% in June from 3.9% in May — is the metric the Fed has explicitly flagged as a key input into its reaction function. Year-ahead expectations are still running at 4.6%, down from 4.8% but more than a full percentage point above the 3.4% reading from February, before the Iran conflict reshaped the energy market. If long-run expectations tick back up toward 3.5% or higher in today's preliminary print, the front end of the Treasury curve will reprice and the probability of a July 29 hike — currently near zero in fed funds futures — will move meaningfully.
The structural setup is unambiguous: core CPI at 2.6%, PCE inflation forecast at 3.6%, nine hawkish dots on the plot, and a Fed chair who spent two days on Capitol Hill this week without once suggesting the coast is clear. June's headline CPI is a one-month energy distraction. The July 29 meeting is where this actually resolves — watch the 4.13% level on the 2-year as the line in the sand. A break above 4.25% before the decision would signal the market is finally pricing what Warsh's dot plot already told it six weeks ago.
The Weekly Investor
Daily market analysis for active traders. Free.