Bitcoin at $62,852: ETF Inflows Snap 10-Day Bleed
Bitcoin trades at $62,852 as spot ETFs snap a 10-day outflow streak with $221.7M in a single session. Here's what traders need to watch.
Key Points
- US spot Bitcoin ETFs snapped a 10-day outflow streak with $221.7M in net inflows on July 6, led by BlackRock's IBIT at $209.4M — the largest single-day haul in two months.
- The inflow reversal coincides with BTC bouncing 7.8% off its $58,189 20-month low, but daily RSI at 48.58 and the EMA50 ceiling at $65,449 signal the rally is not yet structurally confirmed.
- Watch $61,979 as the critical support floor and the July 17 Senate CLARITY Act hearing as the next binary catalyst for this trade.
Bitcoin's most important number this week isn't the price — it's $221.7 million. That's what US spot Bitcoin ETFs pulled in on July 6, ending a 10-day outflow streak that had methodically stripped the market of its structural bid. Bitcoin is currently trading at $62,852, down 2.40% on the session, but the ETF reversal is the signal traders need to interrogate before deciding whether this bounce has legs or is just another dead-cat extension off the $58,189 floor.
The ETF Number That Changes the Calculus
Ten consecutive days of outflows from spot Bitcoin ETFs had done real damage heading into last week. June was already the worst month on record for these funds — billions drained in a relentless sell-down that Wintermute analysts directly tied to the collapse of $60,000 as structural support in late June. When Bitcoin hit $58,189, its lowest print in 20 months, the options market had already done the heavy lifting: open interest concentrated around the $60,000 strike evaporated at the June expiry, leaving nothing to defend the level.
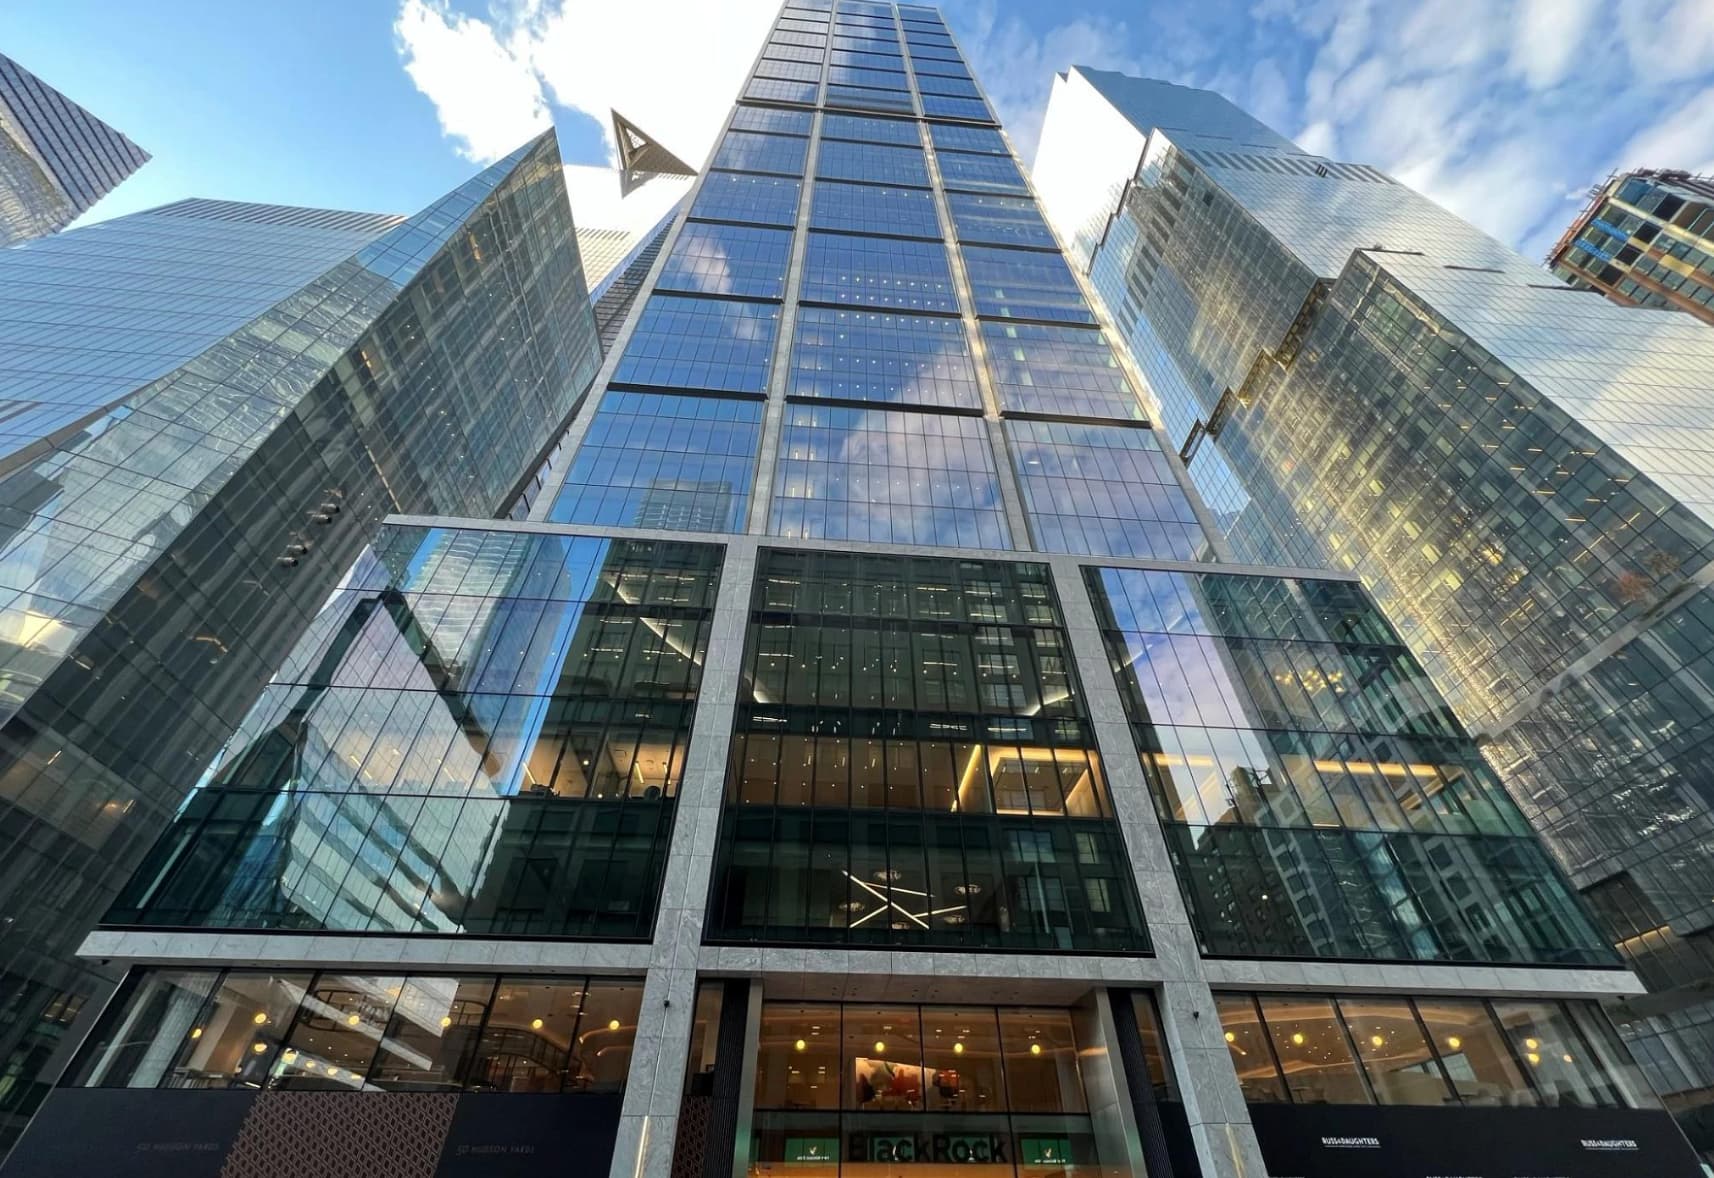
July 6 broke the pattern. BlackRock's IBIT alone absorbed $209.4 million in a single session. Total daily net inflows across all spot BTC ETFs reached $265.7 million when accounting for ARK 21Shares' ARKB ($33M) and Grayscale's Mini Bitcoin ETF ($42.3M). The second straight positive session extended the reversal signal, though Grayscale's legacy GBTC vehicle continued hemorrhaging — $44.5 million in outflows on July 6 alone, a reminder that the product-level divergence inside the ETF complex is still very much alive. IBIT and GBTC are not the same trade, and conflating them has cost retail investors context all year.
The scale of the IBIT number matters beyond the headline. A $209.4 million single-fund inflow from BlackRock's product implies institutional-scale ticket sizes, not retail accumulation. That distinction is meaningful at a moment when the Fear and Greed Index sits at 22 — deep Extreme Fear — because it suggests at least some large allocators are buying into weakness rather than capitulating alongside it. Bitcoin dominance at 56.08% reinforces the same read: capital isn't rotating to altcoins, it's consolidating into BTC specifically, the asset with the deepest ETF wrapper and the most institutional on-ramp.
What the Chart Is Actually Telling You
The technical structure is genuinely split across timeframes, and that split is the trade. On the daily chart, RSI sits at 48.58 — the precise definition of no-man's land, neither oversold nor building upside momentum. The MACD histogram shows bearish momentum decelerating but not yet reversing. Bitcoin is trading above its EMA20 at $62,632, which is constructive, but the EMA50 at $65,449 is 4.1% above current price and has not been tested since before the June breakdown. That level is where the bounce narrative gets its first real examination.
Drop to the 1-hour chart and the picture improves materially. Price at $62,874 sits above all three key EMAs — EMA20 at $62,388, EMA50 at $62,612, and EMA200 at $62,188 — in a clean stacked configuration that signals healthy short-term trend alignment. Hourly RSI at 58.83 has room to extend toward the 70 overbought threshold without triggering an immediate fade signal. Average True Range north of $2,000 means a single session can undo a two-day trend, so the intraday setup is more of a guide for entry timing than a directional conviction call.
The support level that matters most is $61,979 — the daily S1. Below that, BTC has limited technical structure until the $58,189 low reasserts itself as the line in the sand. The all-time high of $126,198, set on October 6, 2025, is now 50% above current price. That figure is worth keeping in the peripheral view not because it's a near-term target but because it quantifies the depth of the structural damage that has occurred in nine months. A 50% drawdown from ATH with a Fear and Greed reading of 22 is historically the kind of setup that precedes violent recoveries — but timing those recoveries has destroyed more accounts than it has built.
What Traders Watch Next
The macro backdrop is not cooperating. The 10-year Treasury yield at 4.55% continues to offer a risk-free alternative that makes Bitcoin's volatility harder to justify for institutional allocators operating under mandate constraints. CPI inflation running at 4.2% year-over-year as of May keeps the Fed from pivoting dovish — the Fed Funds Rate sits at 3.63%, and SOFR at 3.62% confirms the market isn't pricing aggressive cuts anytime soon. Trump's remarks reigniting Iran war concerns, flagged in Bloomberg headlines this week, added a geopolitical risk-off layer that hit crypto alongside equities. Strategy's reported $216 million Bitcoin sale during an internal overhaul was the kind of headline that compounds sentiment damage even when the actual market impact is debatable.
The single most important date on the crypto calendar is now July 17 — the US Senate CLARITY Act hearing. This is not a background regulatory event. The CLARITY Act directly addresses the jurisdictional boundary between the SEC and CFTC for digital assets, and its passage or failure will either unlock or further delay institutional custody frameworks that several major allocators have cited as a precondition for larger BTC positions. The SEC's parallel "Regulation Crypto" agenda — which includes new registration exemptions allowing crypto startups to bypass full securities registration for up to four years — is also moving through formal rulemaking. The regulatory overhang has been the single most consistent reason institutional capital has remained cautious on altcoins specifically, even as IBIT inflows suggest some appetite exists for BTC specifically.
Wintermute's caution is the right frame heading into next week: one session of $221.7M in ETF inflows ended the streak, but year-to-date flows remain deeply negative, and the ETF complex has cycled through multiple brief inflow windows in 2026 before resuming outflows. The trade here is to watch whether IBIT sustains five or more consecutive days of positive flows above $100M daily — that would mark a genuine demand shift, not a one-session anomaly. Hold $61,979 on the downside. Clear $65,449 on the upside with volume and daily RSI crossing 55. Until both conditions are met, BTC is a range trade in Extreme Fear, not a breakout.
The Weekly Investor
Daily market analysis for active traders. Free.